
Figure 7.
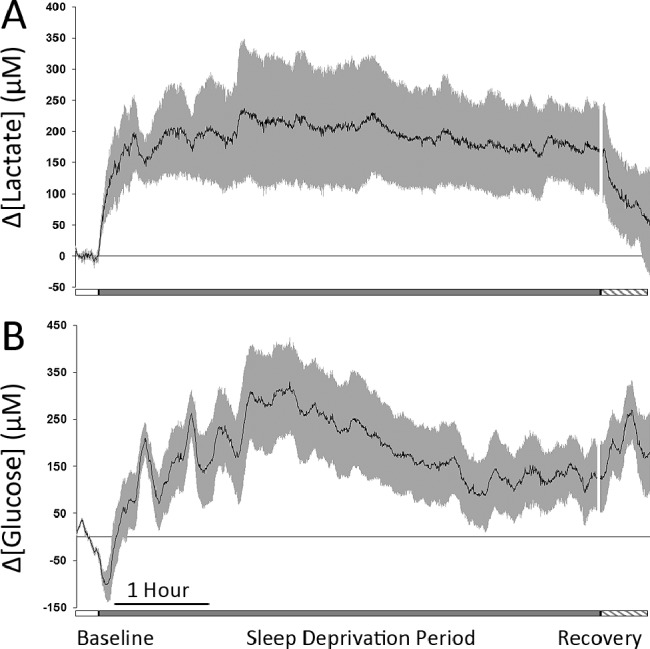
(A) Average lactate concentration change in five animals during 15 min baseline (open bar), 6-h of enforced sleep deprivation (gray bar), and 30 min of recovery sleep (hatched bar). (B) Average glucose concentration change in five animals during 15 min baseline (open bar) and 6-h of enforced sleep deprivation (gray bar). In both graphs, the black line indicates the mean change in concentration from baseline values and the gray bars indicate standard error of the mean.