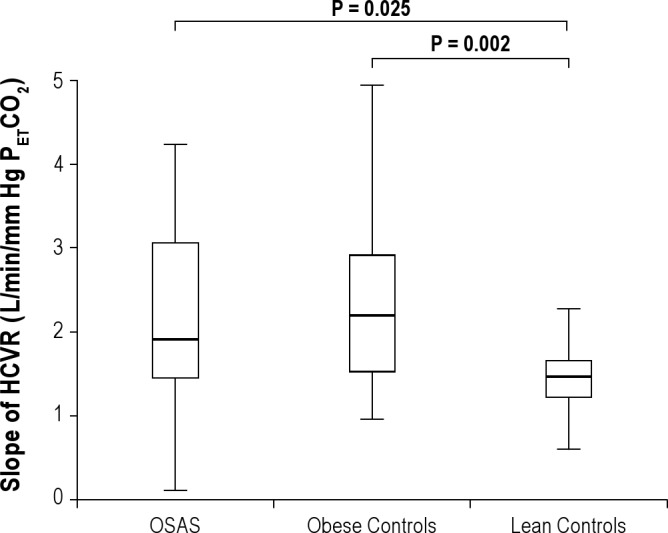
Figure 1.

Slope of Hypercapnic Ventilatory Responses (HCVR). Box plots of the slope of the hypercapnic ventilatory responses (HCVR) are shown. The box represents the interquartile range that contains 50% of the values. The line across the box indicates the median. The whiskers extend from the box to the highest and lowest values. The HCVR was lower in the lean control group than in the obese OSAS and obese control groups.
