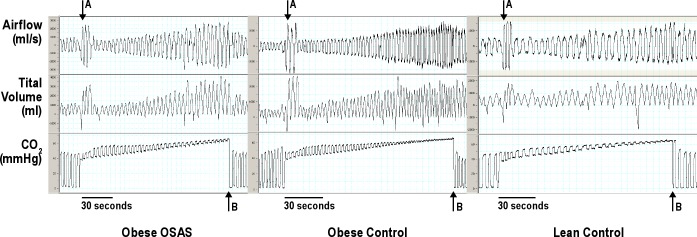
Figure 2.
Typical Examples of Airflow and Tidal Volume Changes During Hypercapnic Ventilatory Response Testing. Typical examples of air flow and tidal volume changes during hypercapnic ventilatory response testing from obese obstructive sleep apnea syndrome (OSAS), obese control, and lean control male study participants are shown. The time scale for each example is shown at the bottom of each plot. The arrow A designates the time point at which the study participant took 3 big breaths to equilibrate with the bag. The arrow B designates the time point at which end-tidal CO2 reached 65 mmHg.

