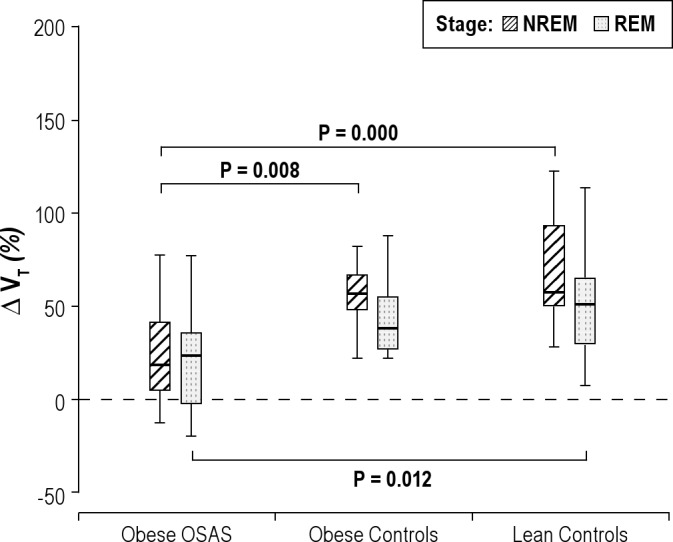
Figure 6.

Percentage change in tidal volume during NREM and REM sleep. The percentage change in tidal volume (VT) during nonrapid eye movement (NREM) and rapid eye movement (REM) sleep is shown for the 3 groups. See Figure 1 for a description of the box plots. During NREM sleep, study participants with obstructive sleep apnea syndrome (OSAS) had a lower percentage change in VT in response to CO2 than those in the control groups. During REM sleep, those in the OSAS group had a lower percentage change in VT than those in the lean control group.
