
Figure 3.
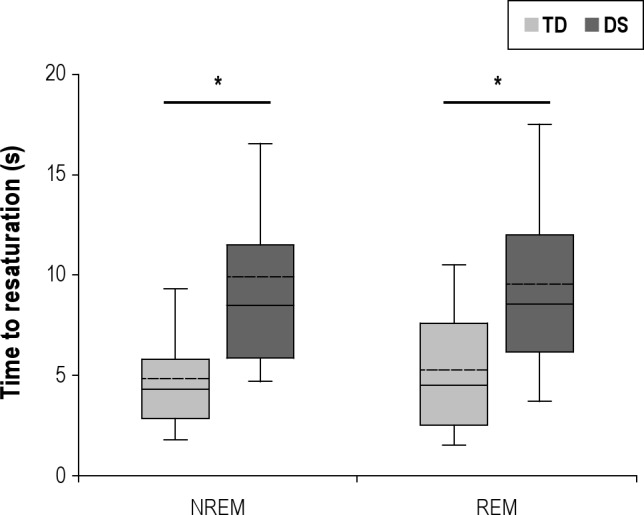
Boxplots of the time to oxygen resaturation post-event in children with Down Syndrome (DS) and typically developing (TD) children during NREM and REM. The boundary of the box closest to zero indicates the 25th percentile, the solid line within the box marks the median, and the boundary of the box farthest from zero indicates the 75th percentile. Whiskers above and below the box indicate the 90th and 10th percentiles. The dotted line within each box represents the mean. *P < 0.05.