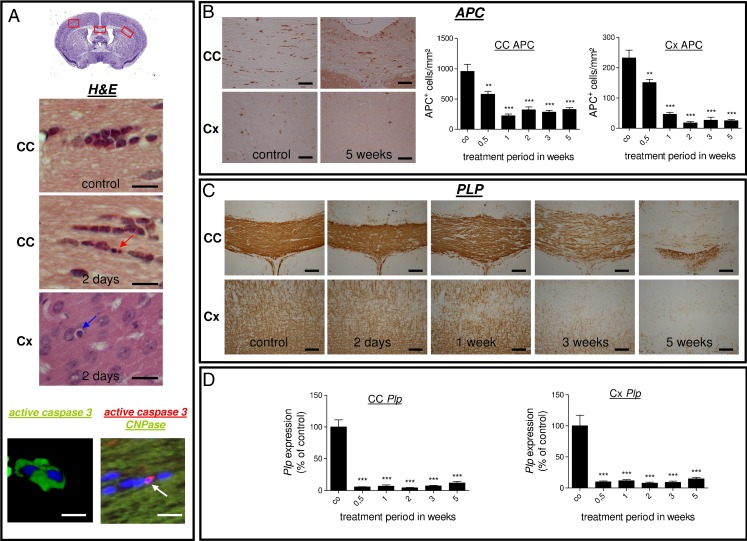
Fig. 1.
a HE-stained sections of the midline of the corpus callosum in control and 2 days cuprizone-treated animals as well as a 2-day cortex sample. On day 2 after the start of the cuprizone diet, cells with the typical morphological characteristics of apoptosis, such as round, condensed, and fragmented nuclei, were detected in both regions (red and blue arrows). The apoptotic nature was further verified by anti-caspase 3 staining (lower left) and anti-caspase 3/CNPase double labeling (lower right). b Left part Anti-APC stained sections of the midline of the corpus callosum as well as cortex regions of a control animal and after 5 weeks of cuprizone exposure. Right part Results of APC-expressing cell quantification within the corpus callosum and cortex regions. c Anti-PLP-stained sections of the midline of the corpus callosum and cortex regions in control and 2 days and 1, 3, and 5 weeks cuprizone-treated animals. Note that no overt loss of PLP staining intensity can be observed until week 1 in both regions included in the study, whereas the midline of the corpus callosum and the cortex regions are significantly demyelinated at week 3. Demyelination further progresses until week 5. d Results of Plp gene expression analysis of the entire corpus callosum or cortex region. Each bar represents the averaged fold induction over untreated control mice of at least four mice per time point (±SEM). Values were normalized against a housekeeping gene (18s) and expressed relative to the respective control levels. *p ≤ 0.05; **p ≤ 0.01; ***p ≤ 0.001 treatment vs. control. Scale bars, 15 μm (upper part in a); 10 μm (lower left in a); 5 μm (lower right in a); 50 μm (b); and 80 μm (c)

