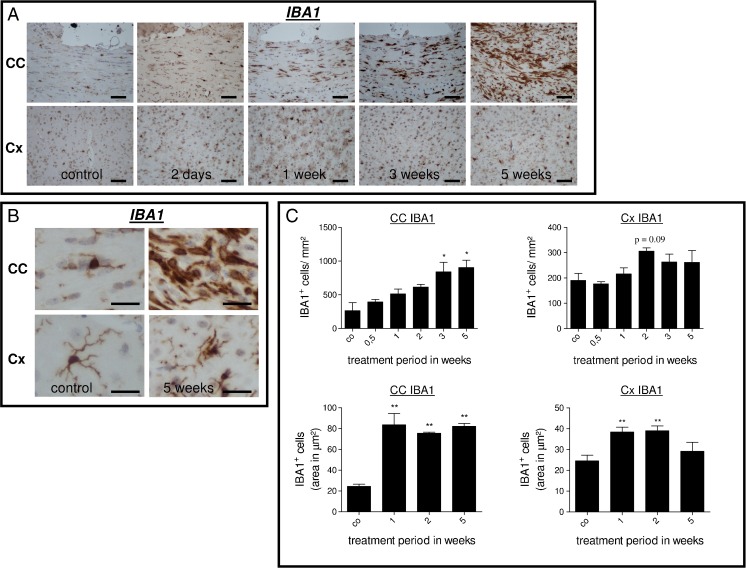
Fig. 2.
a Anti-IBA1-stained sections of the midline of the corpus callosum and cortex regions in control and 2 days and 1, 3, and 5 weeks cuprizone-treated animals. Note the early increase in microglia cell numbers at day 2 and the pronounced increase at week 5, respectively. b Higher magnification micrographs of IBA1-positive cells within the midline of the corpus callosum and cortex regions in control animals and after 5 weeks cuprizone treatment. Note the pronounced increase in number and size after 5 weeks within the midline of the corpus callosum. c Upper row Results of IBA1-expressing cell quantification within the corpus callosum and cortex regions. Lower row Morphometric quantification of IBA1-expressing cell area within the corpus callosum and cortex regions. Note that microglia hyperplasia and hypertrophy are more pronounced in the affected white matter corpus callosum compared to the gray matter cortex region. *p ≤ 0.05; **p ≤ 0.01; ***p ≤ 0.001 treatment vs. control. Scale bars, 50 μm (a) and 15 μm (b)

