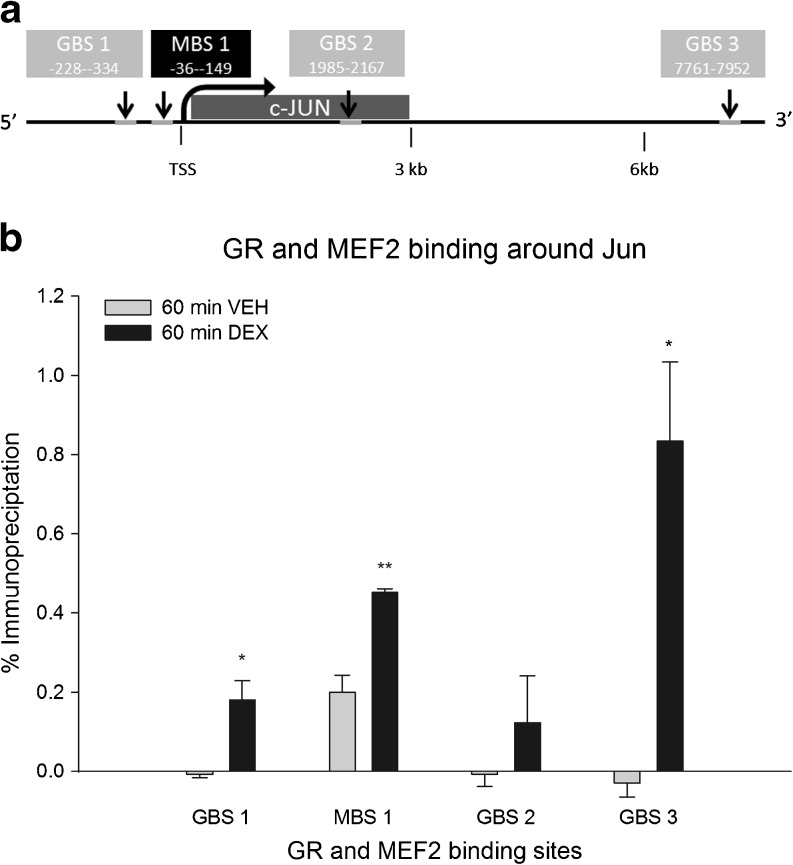
Fig. 5.
Binding levels of GR and MEF2a in the vicinity of the c-JUN gene (n = 3 per group). a Schematic overview of the c-JUN gene and surrounding sites. GR binding sites 1, 2, and 3 are depicted in grey and the MBS1 is depicted in black. Numbers inside the boxes indicate distance from the beginning and end of the peak to the TSS. b ChIP results representing DNA-binding of GR at three distinct binding sites designated GBS1, GBS2, and GBS3, and DNA-binding of MEF2a at the MEF2-binding site designated MBS1. Results are immunoprecipitated fractions plotted as percentage of total input DNA. The immunoprecipitated fraction is normalized to IgG binding (*p < 0.05, **p < 0.01 sign. vs VEH treatment)

