
Figure 1.
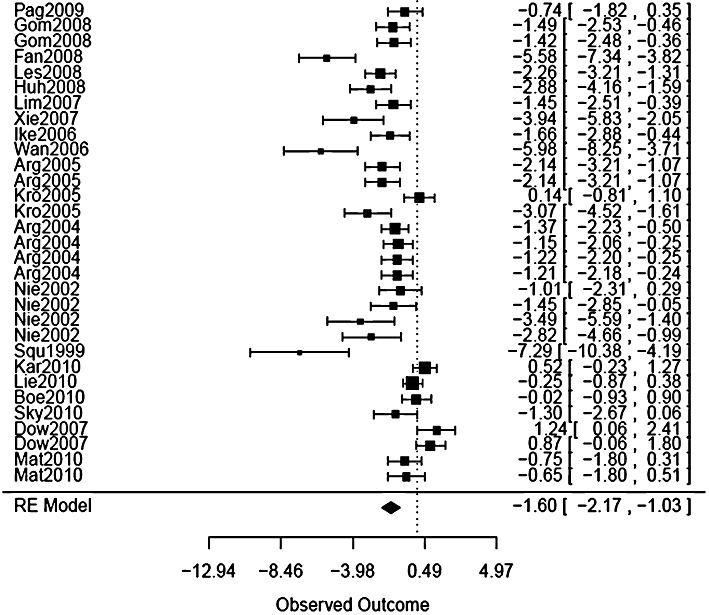
Forest plot of the size of effect of cyclosporin on infarct size. A forest plot illustrates the relative strength of treatment effects in individual scientific studies that address the same question and so graphically represents a ‘meta-analysis’ of a group of these studies.