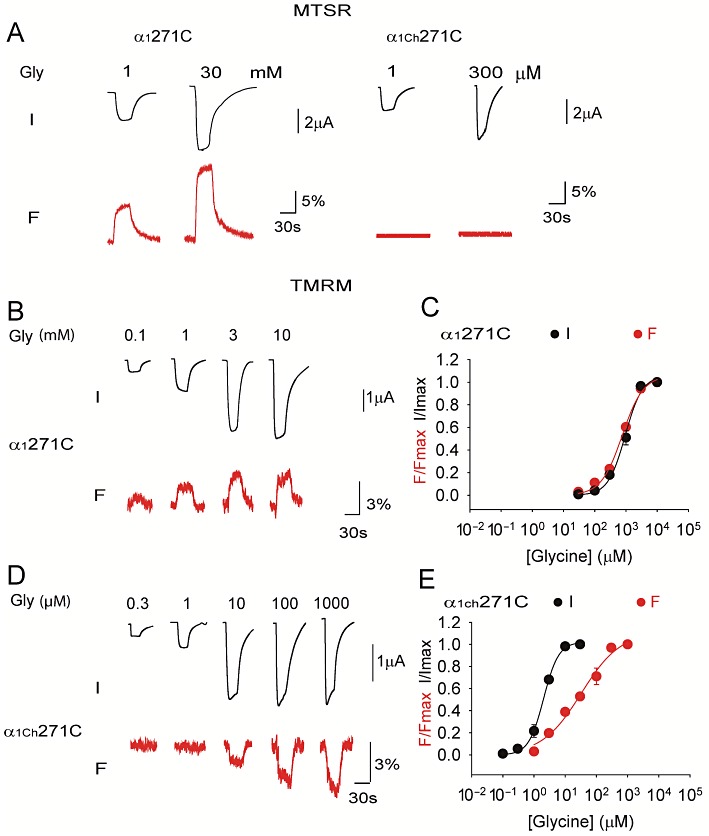
Figure 5.

VCF of the α1 and α1Ch glycine receptors. Example current (I) and fluorescence (F) traces of the α1271C and α1Ch271C glycine receptors labelled with MTSR or TMRM are shown in (A), (B) and (D). Averaged normalized glycine dose-response curves of current (I) and fluorescence (F) of the α1271C and α1Ch271C glycine receptors labelled with TMRM are shown in (C) and (E), respectively (n= 4 or 5).
