
Figure 1.
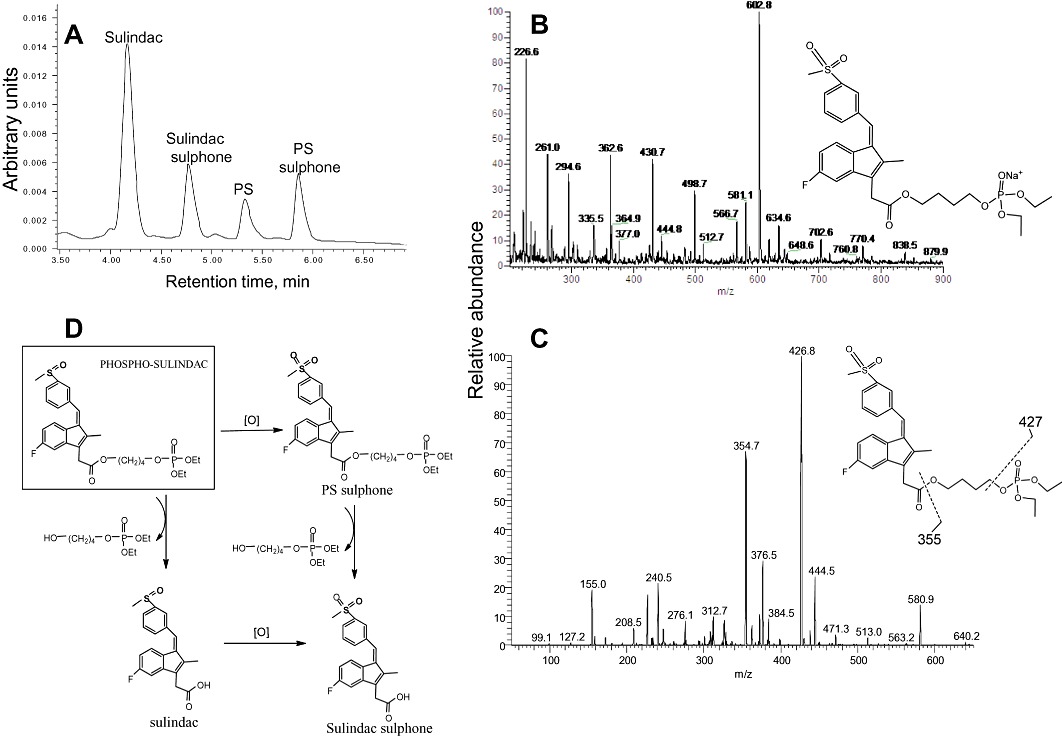
Metabolism of PS by rat and HLMs. (A) HPLC profile of PS and its metabolites generated by RLM 10 min after PS was incubated with RLM. PS and its metabolites were extracted and fractionated by HPLC. (B) MS spectrum of PS sulphone fraction collected from HPLC. (C) MS/MS spectrum of the major fragment ions of the PS sulphone ion. (D) Metabolic transformations of PS by liver microsomes.