
Figure 5.
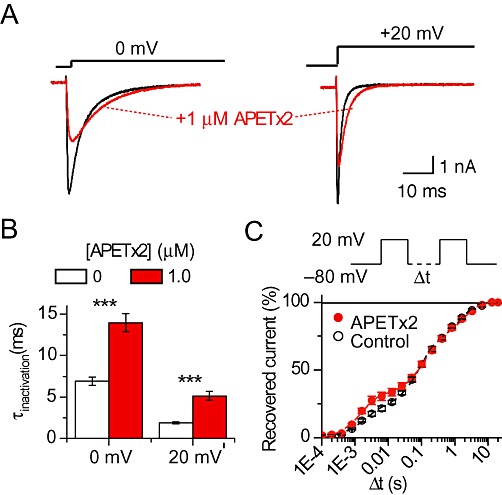
APETx2 modulates the kinetics of Nav 1.8 channel gating. Currents were recorded from acutely-dissociated DRG neurones, with all bath solutions containing 300 nM TTX. (A) APETx2 slows inactivation kinetics. Representative traces obtained for test potentials of 0 or +20 mV in the presence or absence of 1 µM APETx2 are shown. (B) The falling phase of the individual current traces was fitted to a single exponential equation (see Methods), yielding the time constant of inactivation (τinactivation). Values of τinactivation obtained at test potentials of 0 and +20 mV in the presence or absence of 1 µM APETx2 are shown, ***P < 0.001, significant effect of APETx2; n= 20–23, paired t-test. (C) Recovery from inactivation was determined by measuring the current evoked by two 100 ms depolarizations to +20 mV, separated by an interval of increasing duration at −80 mV as illustrated in the top panel. The current amplitude of the second depolarization, normalized to that of the first depolarization, is plotted as a function of the interval Δt for the situation with or without (control) 1 µM APETx2. Three exponential components were necessary to fit the recovery time course (n= 5). Fit parameters, as time constant τ (% relative weight of the component) are as follows with *P < 0.05 and **P < 0.001, significant effect of 1 µM APETx2: (control values given first) the fast component 2.03 ± 0.10 ms ((20 ± 2%) and 1.64 ± 0.06 ms* (31 ± 4% **), the intermediate component 95 ± 12 ms (48 ± 2%) and 139 ± 18 ms** (40 ± 4% *) and the slow component 1600 ± 200 ms (32 ± 1%) and 2030 ± 160 ms (28 ± 2%).