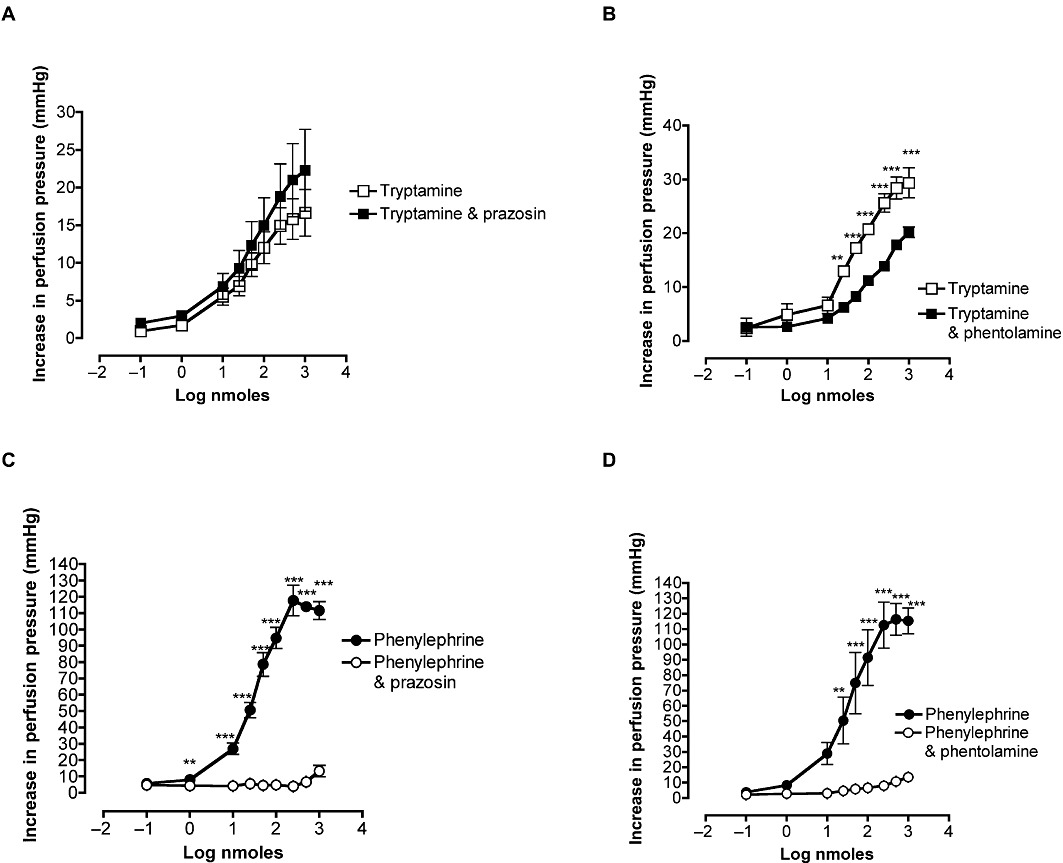
Figure 4.

Effects of prazosin (A and C, 10 nM) and phentolamine (B and D, 1 µM) on the dose–response curves for increases in perfusion pressure of rat-isolated perfused mesenteric vascular beds to tryptamine (A; n= 4 and B; n= 3) and phenylephrine (C; n= 3 and D; n= 3). Points are means ± SEM. **P < 0.01 ***P < 0.001, significant effect of antagonist; ANOVA and Bonferroni post-test.
