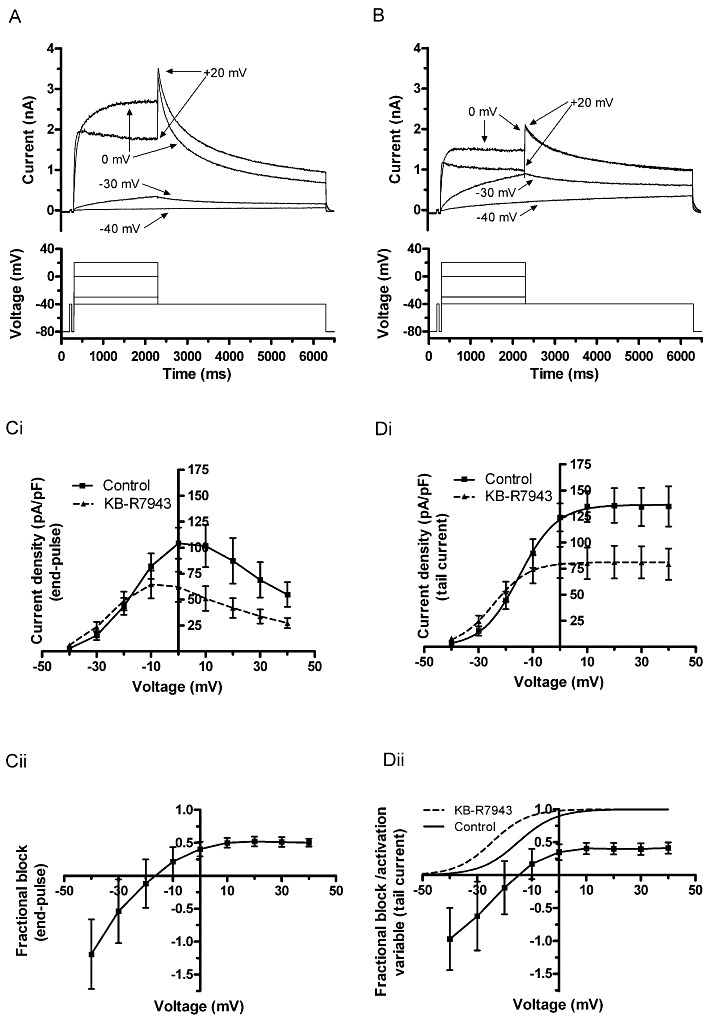
Figure 2.

Voltage-dependence of IhERG inhibition by KB-R7943. Upper traces show representative IhERG records in control (A) and in the presence of 100 nM KB-R7943 (B). Lower traces show corresponding voltage steps in the experimental protocol. Currents were evoked by a series of 10 mV increments of step depolarizations between −40 and +40 mV from a holding potential of −80 mV. However, for clarity of display, only selected steps are shown. (Ci) Mean I–V relation for end-pulse currents in control and in the presence of 100 nM KB-R7943 (n= 6 cells). (Cii) Mean fractional block of end-pulse currents against voltage. (Di) Mean I–V relation for IhERG tails in control and in the presence of KB-R7943 (n= 6 cells). Data were fitted with a Boltzmann equation to give V0.5 and k values in the Results text. (Dii) Corresponding plot of mean fractional block of tail currents. Superimposed on this plot are continuous plots describing voltage-dependent activation of IhERG in control and KB-R7943.
