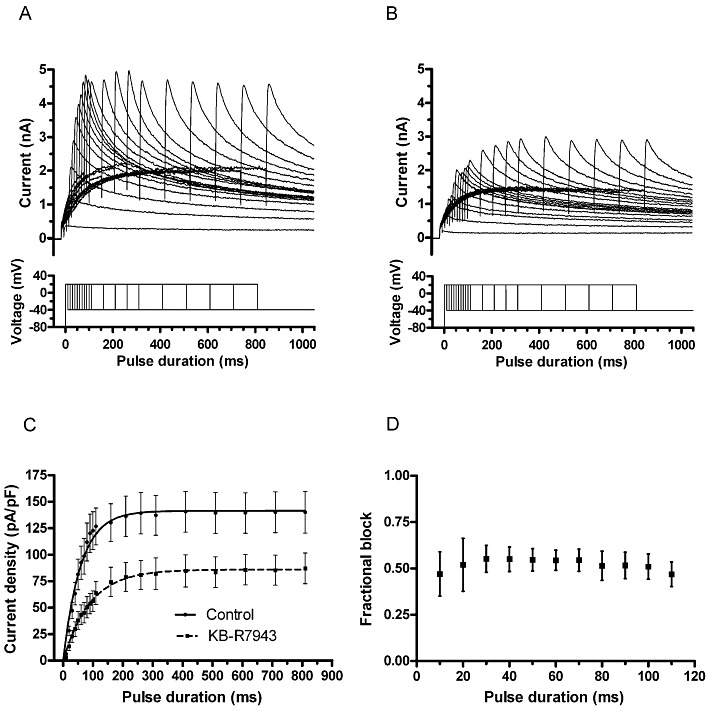
Figure 3.

Time course of IhERG activation and KB-R7943. (A, B) Upper traces show representative currents elicited by envelope of tails protocol shown as lower traces in each panel: (A) currents in control and (B) during exposure to KB-R7943. (C) Mean plots of current amplitude against depolarizing pulse duration (n= 8), fitted with a single-exponential equation to yield τ values given in the Results text. (D) Plot of mean level of fractional block, focusing on the first 110 ms of the protocol. There was no statistically significant time-dependent difference in this (one-way anova).
