Figure 5.

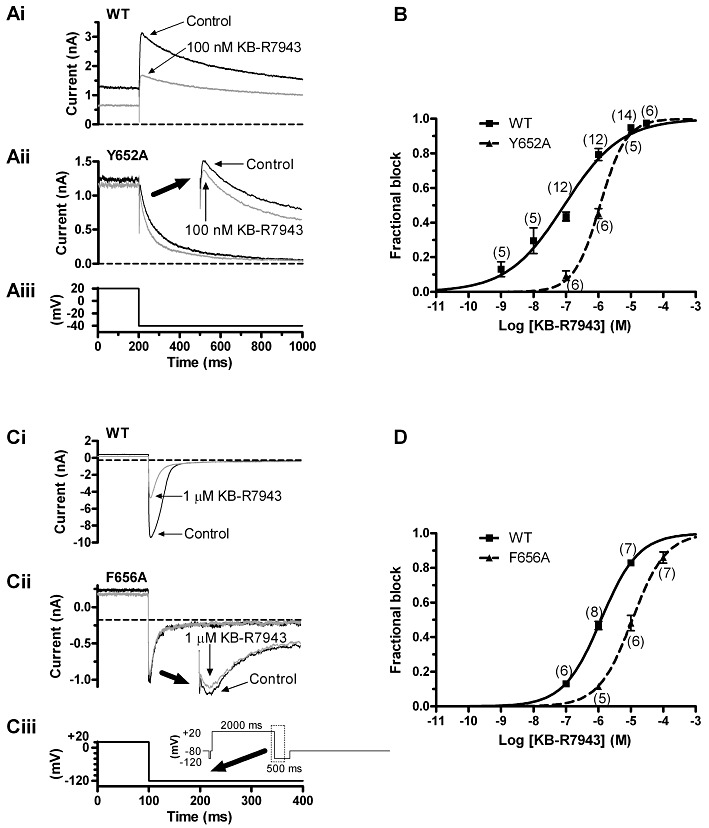
Effects of the Y652A and F656A mutations on the action of KB-R7943. (A) The traces in panels Ai and Aii show, respectively, WT IhERG and Y652A IhERG elicited in the absence and presence of 100 nM KB-R7943. The corresponding voltage protocol is shown in panel Aiii. (B) Mean data indicating effects of three concentrations of KB-R7943 on Y652A IhERG, fitted by Equation 1 to give the IC50 and nH values given in the text. The concentration–response relation for WT IhERG (identical to that shown in Figure 1) is shown overlain, for comparative purposes. (C) The traces in panels Ci and Cii show, respectively, WT IhERG and F656A IhERG elicited in the absence and presence of 1 µM KB-R7943. The corresponding voltage protocol is shown in panel Ciii and its inset. Experiments performed with high (94 mM) [K+]e. (D) Mean data indicating effects of three concentrations of KB-R7943 on each of WT and F656A IhERG tails, measured at −120 mV, fitted by Equation 1 to give the IC50 and nH values given in the text. For A and C, the horizontal dashed lines are drawn at the level of the current at the pre-pulse of −40 or −120 mV, against which peak tail current amplitudes were measured. For B and D, numbers in parentheses indicate numbers of replicates at each drug concentration tested on WT and mutant channels.
