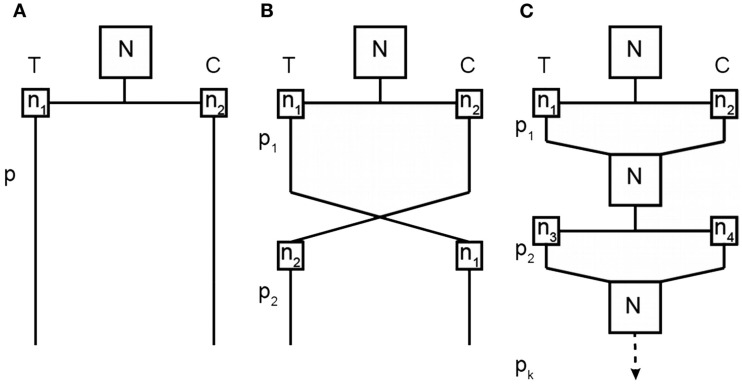
Figure 2.
Comparison of a two-arm parallel groups design (A), a two-period crossover design (B), and the RRD (C). T represents the treatment group and C the control group; N is the total sample size for each experiment; n is the group size for a particular treatment condition at a particular time point (with subscripts differentiating between unique groups of subjects); and p is the treatment period (with subscripts identifying which treatment period).

