
Figure 6.
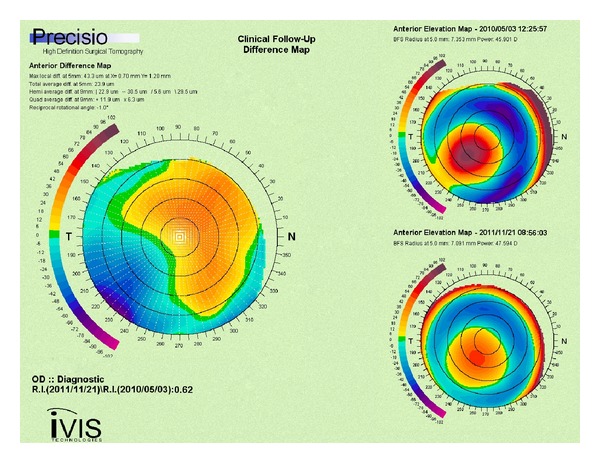
Scheimpflug anterior elevation difference map showing depression at the cone and increased elevation orthogonally (left image). Scheimpflug anterior elevation maps (right images): preoperative (upper) and 12-months after epithelium-on CXL (lower).