Figure.
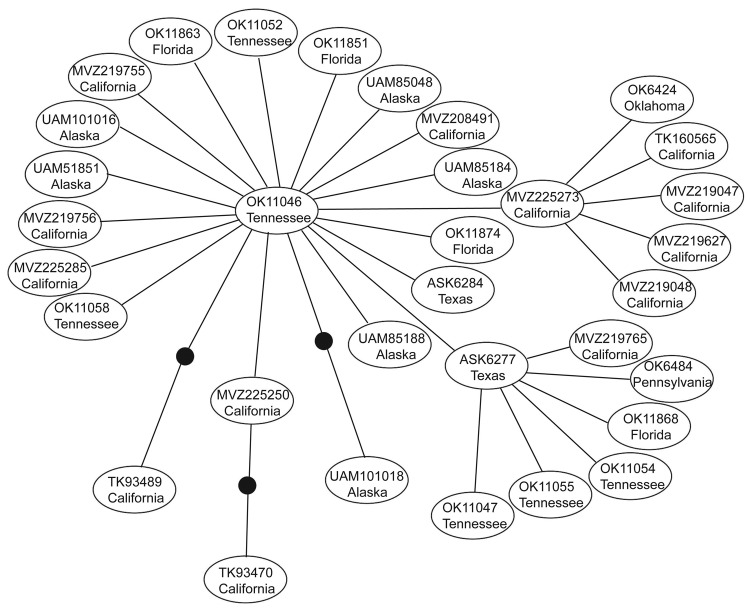
Genetic network showing the relationship among all hepatitis E virus genotype 3 sequences obtained in this study from isolates from wild rats collected in the United States. Each line represents a single mutational event and closed circles represent extinct or unsampled sequences. Each oval represents a single isolate, and the label corresponds to the tissue number shown in the Technical Appendix and the general sampling locality.

