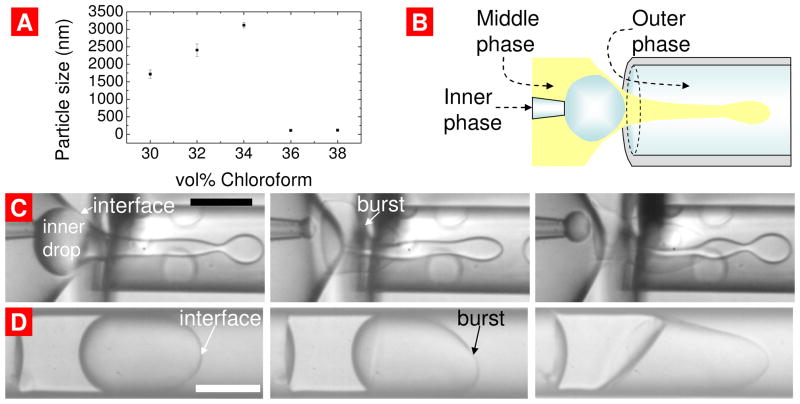
Figure 3.
A) Size of the aggregates as a function of the volume fraction of chloroform in the solvent mixture; B) Illustration of the geometry of the microchannel for studying the stability of the double emulsions generated; C) Series of optical microscope images showing the coalescence of the inner droplet with the outer phase before generation of a double emulsion drop. ‘Burst’ refers to the process of coalescence between the inner drop and the outer continuous phase. Due to the slight difference in the refractive indices of the two phases, a halo around the original inner droplet phase can still be observed shortly after the coalescence. The solvent mixture in the middle phase contains 10 mg/mL PEG(5000)-b-PLA(5000) in 30 vol% of chloroform and 70 vol% of hexane. The time interval between successive images is 1 ms and the scale bar is 50 μm. D) Series of optical microscope images showing the destabilization of the double emulsion drop in the microchannel. The solvent mixture contains 10 mg/mL PEG(5000)-b-PLA(5000) in 50 vol% of chloroform and 50 vol% of hexane The time interval between successive images is 1.5 ms and the scale bar is 50 μm.

