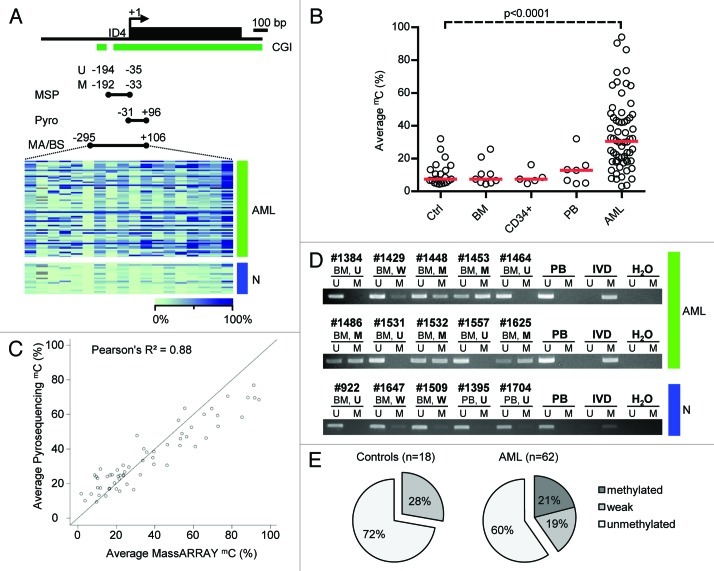
Figure 1. Detailed DNA methylation analysis of the ID4 gene 5′ regulatory region. (A) Schematic representation of the ID4 5′ regulatory region including the adjacent CpG island (CGI). The amplicon analyzed by the MassARRAY (MA) assay and by bisulfite sequencing (BS) in AML samples (green) and healthy controls (blue) is depicted as black bar including the position relative to the transcriptional start site (TSS). The regions analyzed by pyrosequencing and methylation-specific PCR are labeled Pyro and MSP (U for reaction with primers specific for unmethylated DNA, M for methylated), respectively. Quantitative MassARRAY results are displayed as heatmap, columns represent single CpG units, rows represent samples. Bright green encodes for low methylation levels, dark blue for high methylation levels. (B) Distribution of average amplicon methylation values by MassARRAY (mC) in AML samples (AML), pooled healthy controls (Ctrl) and separated healthy controls (BM, whole bone marrow; CD34+, G-CSF mobilized CD34 positive hematopoietic progenitor cells from peripheral blood; PB, buffy coat from peripheral blood). Significance was assessed by two-sided non-parametric Wilcoxon Mann-Whitney test. (C) Scatterplot displaying the correlation for mean methylation levels of CpG dinucleotides asessed by both MassARRAY and pyrosequencing. The correlation is calculated as Pearson's R2. (D) Gel electrophoresis of a representative MSP analysis at the ID4 gene 5′ region in AML samples (green) and healthy controls (blue) demonstrating the different MSP-based methylation categories. The location of the amplicon is indicated in Figure 1A. U and M represent the reaction for unmethylated and methylated DNA, respectively. Peripheral blood mononuclear cells (PB), in vitro methylated DNA (IVD) and water (H2O) served as controls. Sample source (BM, PB) and samples IDs are given above the horizontal bars together with the determined methylation category in bold (U, unmethylated; W, weakly methylated; M, methylated). (E) Pie chart showing distribution of MSP-derived DNA methylation categories in healthy controls (n = 18) and AML samples (n = 62).

An official website of the United States government
Here's how you know
Official websites use .gov
A
.gov website belongs to an official
government organization in the United States.
Secure .gov websites use HTTPS
A lock (
) or https:// means you've safely
connected to the .gov website. Share sensitive
information only on official, secure websites.
