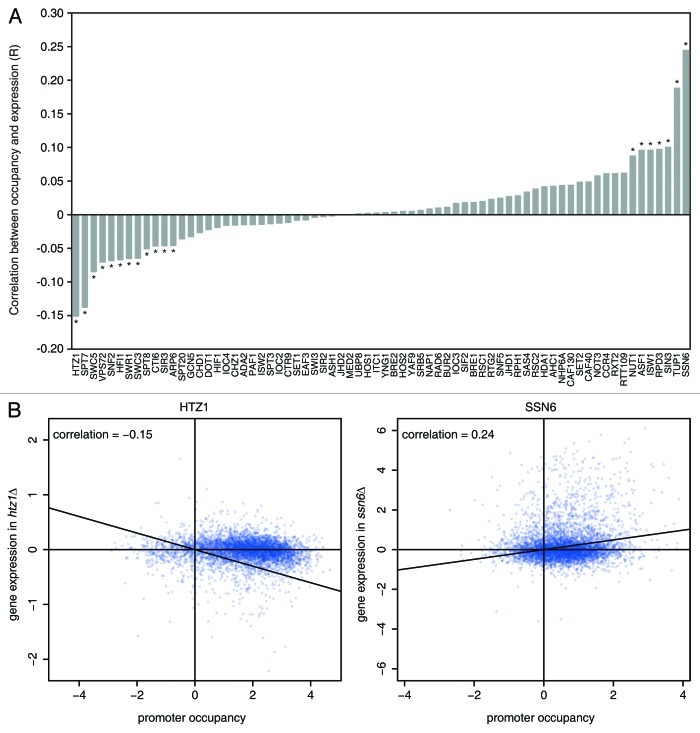
Figure 1. (A) Correlation analysis between occupancy and expression values for 70 chromatin regulators. For the 70 chromatin regulators that overlap between the location and expression data sets, the uncentered cosine correlation (R) is shown between occupancy values at the promoter (maximum value of UAS and TSS probe)7 and mRNA expression changes upon deletion.8 The correlation is based on the 5,482 genes shared between the 2 data sets. Correlation values marked by a star (*) indicate significant correlations (p < 0.01, after Bonferroni multiple testing correction). (B) Correlation plots of promoter occupancy (x-axis) and expression (y-axis) for the highest positive (Ssn6) and highest negative (Htz1) correlation.

An official website of the United States government
Here's how you know
Official websites use .gov
A
.gov website belongs to an official
government organization in the United States.
Secure .gov websites use HTTPS
A lock (
) or https:// means you've safely
connected to the .gov website. Share sensitive
information only on official, secure websites.
