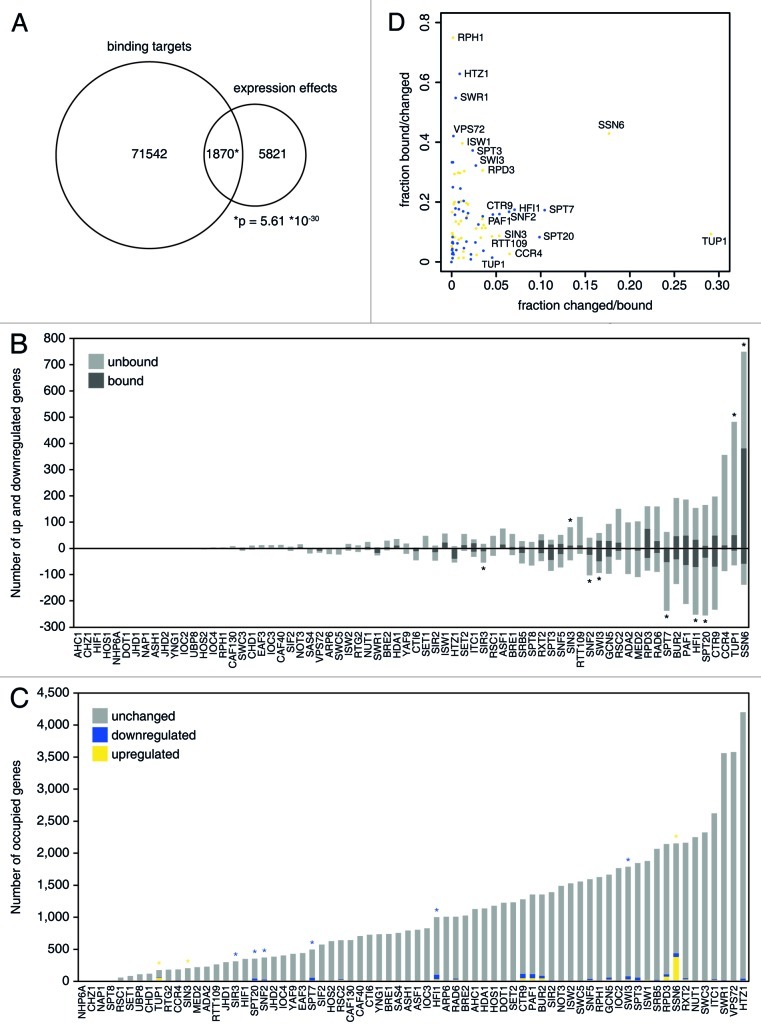
Figure 2. Overlap between occupancy and expression. (A) Venn diagram of overlap between binding targets (5% FDR) and expression effects (fold change > 1.7, p < 0.05) for all overlapping factors. (B) Number of significant up and downregulated genes for deletion mutants of the factors shown on the x-axis. Genes that are also bound by the same factor are colored dark gray. Bars marked by a star (*) show significant overlap between binding and up or downregulated genes (hypergeometric test, p < 0.01). (C) Number of genes occupied by the factors shown on the x-axis. Genes that also show expression effects in the corresponding deletion mutants are colored yellow (upregulation) or blue (downregulation). Yellow and blue stars indicate significant overlap between occupancy and up or downregulated genes, respectively (hypergeometric test, p < 0.01). (D) The fractions bound/changed and changed/bound are plotted for the upregulated genes (yellow dots) and downregulated genes (blue dots) separately.

An official website of the United States government
Here's how you know
Official websites use .gov
A
.gov website belongs to an official
government organization in the United States.
Secure .gov websites use HTTPS
A lock (
) or https:// means you've safely
connected to the .gov website. Share sensitive
information only on official, secure websites.
