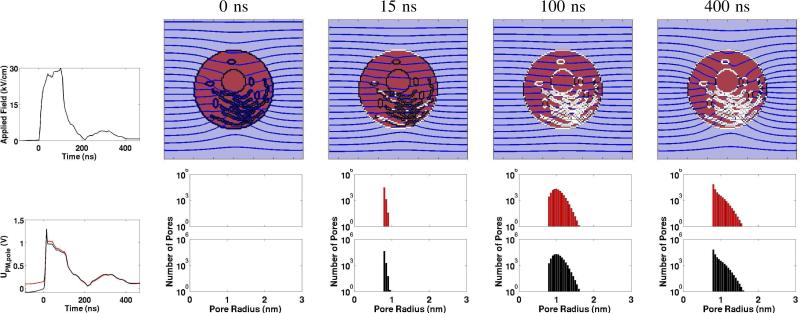
Fig. 2.
nsPEF example [4] with the digitized experimental pulse waveform and model responses. Upper left: Experimental pulse waveform (nominal 100 ns duration, because the small ragged tail is relatively unimportant to the highly non-linear EP response). Lower left: Transmembrane voltage, Um(t) for the anodic (RED) and cathodic (BLACK) poles of the circular cell. The spike following rapid charging is due to a burst of conducting small pores. Upper row of four panels: Spatial distributions of EP sites (WHITE regions; >1013 pores/m2) and equipotentials (black lines/curves; equipotentials of each panel are scaled separately). The top of the system box is an idealized anode (zero electrochemical overvoltage) and the bottom is an idealized cathode, so that the applied field is uniform in the absence of the cell. Lower row of four top/bottom panel pairs: RED PM pore population histograms (bin width 0.05 nm) for the upper (anodic) side of the cell, with BLACK histograms for the lower (cathodic) side. Note the semi-logarithmic scale, showing most pores are small (in the rightmost panel, the peak at the minimum pore size rp ≈ 0.8 nm, and falling off rapidly to one at rp ≈ 1.6 nm for both RED and BLACK distributions).

