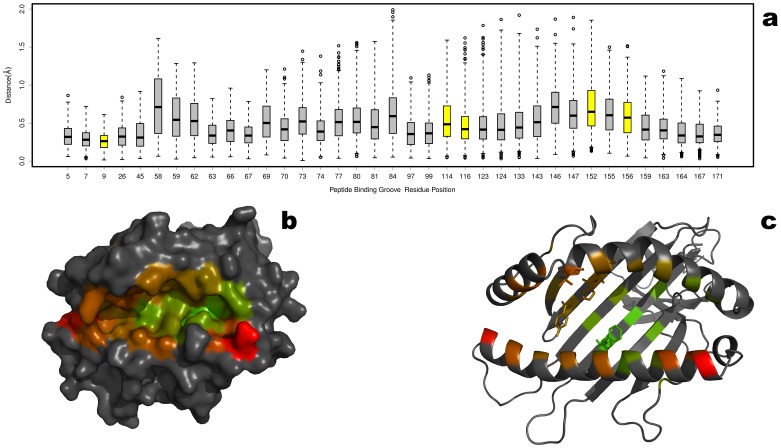
Figure 2. Conservation of the HLA Peptide Binding Groove.
The structural conservation of the peptide binding groove was measured by performing a superposition of 50 unique p-HLA complexes from the PDB. The pairwise RMSD was calculated between the backbone atoms at each solvent accessible residue comprising the binding groove [4]. The results are summarized as a boxplot showing the median, quartiles, maximum and minimum distances, and outliers (circles) at each residue position. The colors are scaled from green to red (lowest to highest RMSD) with minimum values of 0.28 Å (residue 9) and maximum of 0.83 Å (residue 58). For contrast, the non-binding groove residues are colored black. The average RMSDs are color mapped on to the HLA molecule shown as surface representation (b) and cartoon representation (c) from green (low RMSD) to red (high RMSD).

