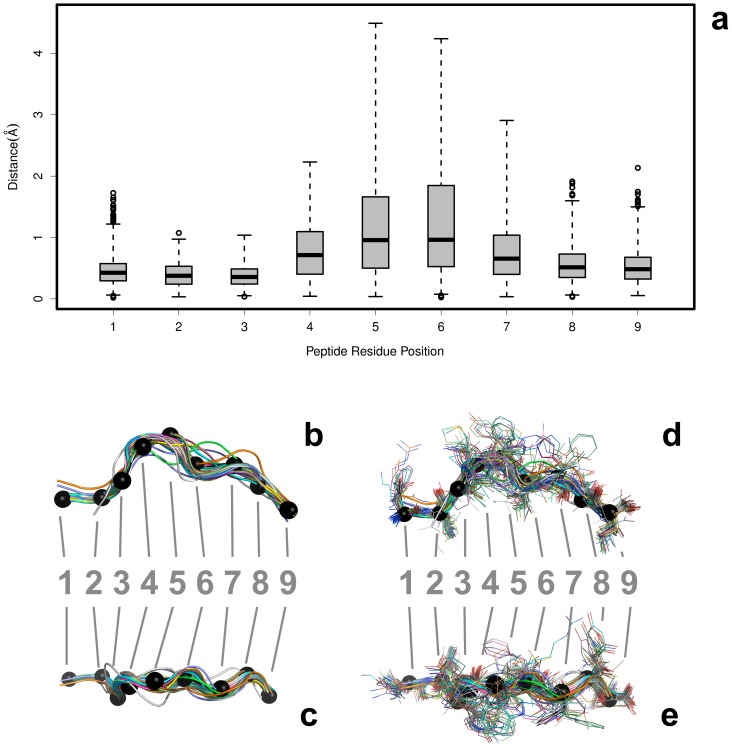
Figure 3. Variability of Peptides Bound to HLA Molecules.
The structural variability at each residue position for bound nonameric peptides in p-HLA complexes from the PDB. After a structural alignment of the HLA molecules, the peptide coordinates were extracted. The aligned peptides are depicted from the side view (b and d) and top (looking down into the binding groove) view (c and e), both with and without side chains. The backbone-only models are shown in B (side view) and C (top-down view). The alignments with the side chains are shown in D (side view) and E (top-down view). The Cα atoms are shown as black spheres. The pairwise RMSD was calculated between the backbone atoms at each residue position for each peptide. The peptides are colored uniquely and, for reference, the Cα atoms from a peptide (PDB id = 1AKJ, chain = C) are shown as black spheres. The results are summarized as a boxplot showing the median, quartiles, maximum and minimum distances, and outliers (circles) at each residue position.

