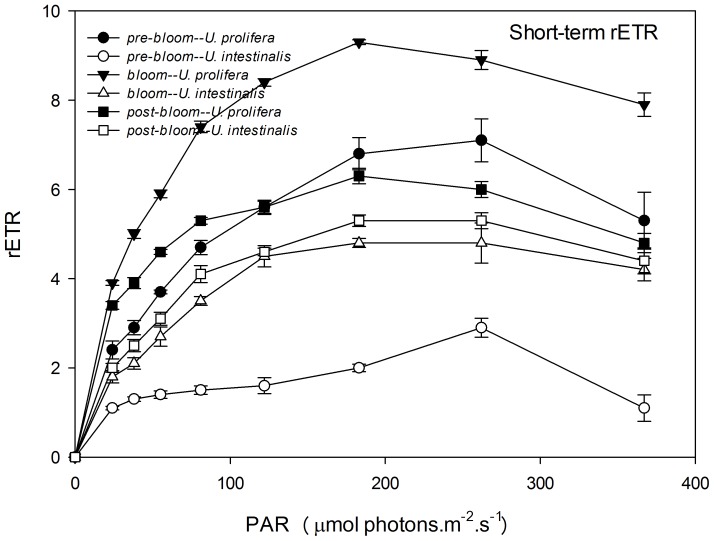
Figure 7. Mean relative electron transport rate (rETR) of rapid light response curves (RLCs) of U. prolifera and U. intestinalis, obtained from short-term (24 h) culture to each, measured under different culture treatments: pre-bloom, bloom, and post-bloom.
Values are means ± SD (n = 5). Different letters above bars indicate significantly different values (post-hoc, P<0.05).

