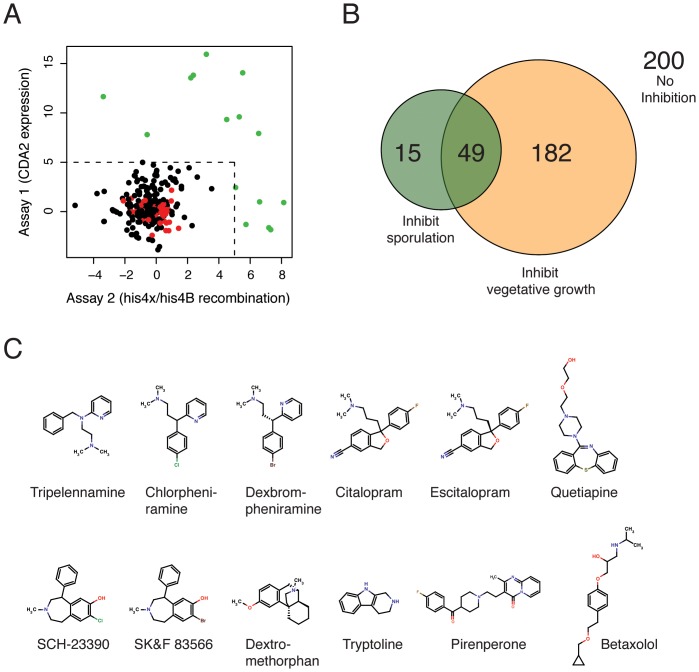
Figure 2. Small molecule inhibitors of yeast sporulation.
(A) A scatterplot of sensitivity scores (calculated as described in the Methods) representing the impact of compounds from the NIH clinical collection in the sporulation screening assays. Compounds that inhibit growth or that interfered with the fluorescence-based assay because of auto-fluorescence were not included in this representation. Compounds with a score of greater than 5 are shown in green. DMSO controls are shown in red. (B) A Venn diagram representing the overlap of inhibitors in the growth assay and the two sporulation assays (colored in yellow and green, respectively). 200 compounds had no effect in any of the three assays, 231 inhibited vegetative growth (of BY4741 and/or AD1-9 strains), and 64 inhibited sporulation. The overlap of between growth and sporulation inhibitors was 49. (C) Chemical structures of 12 sporulation-specific inhibitors that were confirmed to inhibit sporulation by microscopy analysis.

