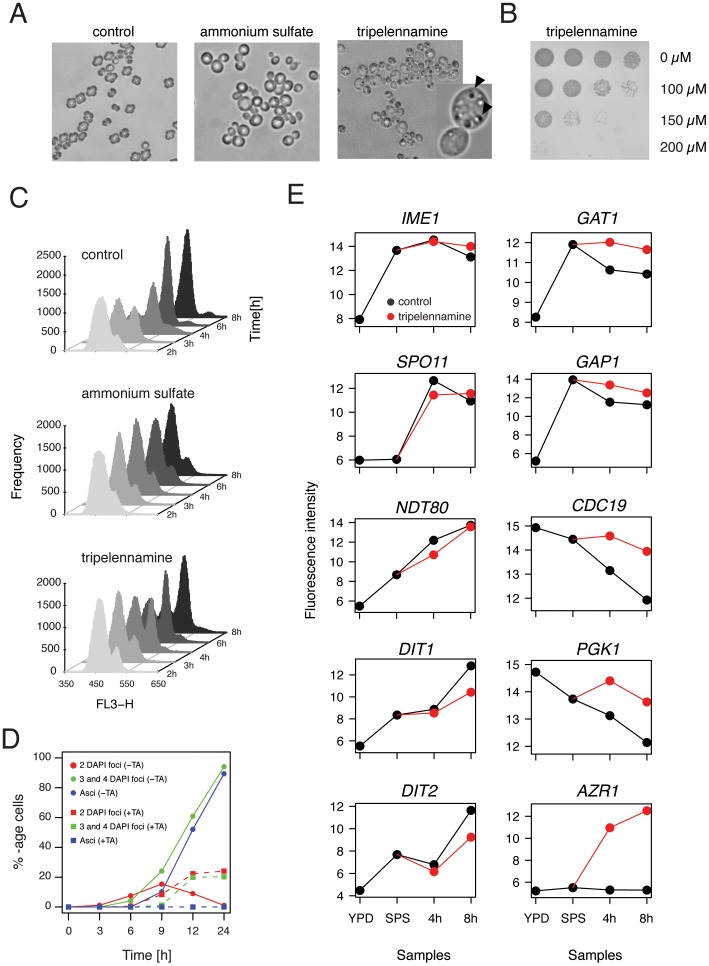
Figure 3. Tripelennamine strongly inhibits viability and meiotic M-phase in sporulating yeast.
(A) Images of Nomarski microscopy of cells sporulated in the absence of drug (control), in the presence of 2 mM ammonium sulfate (AS), or 100 µM tripelennamine (TA) for 24 hours. Part of the TA image was magnified; arrows indicate granular bodies of unknown origin. (B) 5-fold serial dilution of yeast sporulated for 24 hours in the presence of three different concentrations of TA (indicated on the right) and then transferred to rich media in order to determine the rate of cell survival. Pictures were taken after incubating the rich media agar plates for 2 days at 30°C. (C) FACS analysis of pre-meiotic DNA synthesis of a “no drug” control, and in cells treated with ammonium sulfate (2 mM), or tripelennamine (100 µM). Samples were taken at 2, 3, 4, 6, and 8 hours after induction of sporulation. Staggered histograms show the frequencies (plotted on the y-axis) of relative DNA content, measured as propidium iodide intensity (plotted on the x-axis). (D) Percentage of cells that have completed meiotic M-phase (cells with 2 DAPI foci and cells with 3 or 4 DAPI foci) and those that have formed mature asci over time in sporulation medium (given in hours, x-axis) in the absence (control, circles and solid lines), or the presence of 100 µM tripelennamine (treatment, squares and dashed lines). (E) Expression patterns of representative genes involved in meiotic development (left column), nitrogen catabolite repression (GAT1 and GAP1), glycolysis/gluconeogenesis (CDC19 and PGK1), and stress response (AZR1). Log2-transformed fluorescence signals of RMA-normalized microarray data (see Methods) are plotted on the y-axis and are graphed versus samples taken in rich media and pre-sporulation media (in the absence of tripelennamine), or total time (4 and 8 hours) the cultures spent in sporulation media in the absence (black curve) or presence (red curve) of TA.

