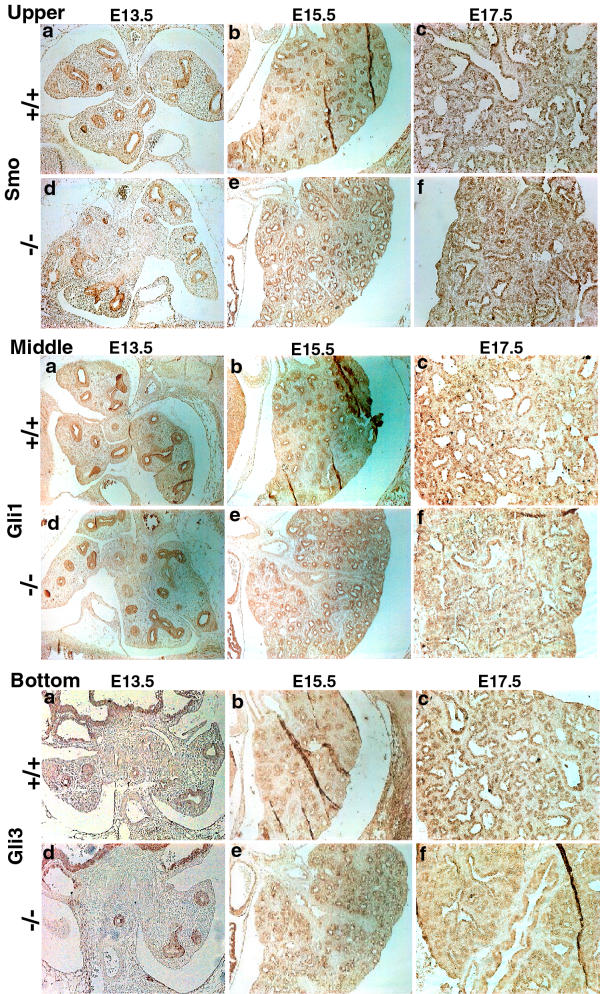
Figure 10.
Comparisons of Smo, Gli1 and Gli3 expression in lung sections. Smoothened (Smo, upper panel), Gli1 (middle panel) and Gli3 (bottom panel) showed a pattern of distribution similar to that seen with Shh and Ptch (compare to Fig. 7). No differences between wild-type (+/+) and knockout (-/-) embryos were evident. Original magnifications: 20X.

