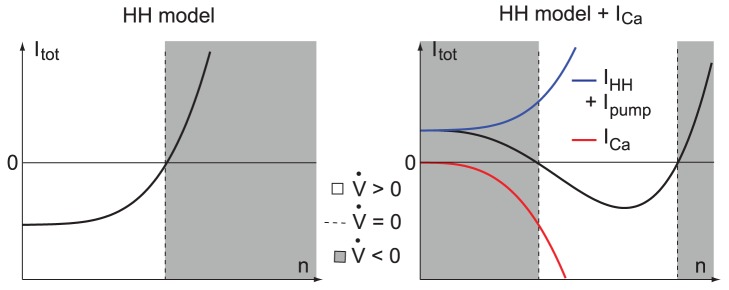
Figure 2. Total ionic currents for  fixed as a function of
  without (left) and with calcium channels (right).
Blank portions corresponds to the values of  where
where  , shaded portions corresponds to the values of
  where
where  , and the dashed lines correspond to the values of
  where
where  . The hyperpolarizing calcium pump current
  accounts for the vertical shift of the curve in the right figure. Note that the total ionic currents monotonically increase only in the absence of calcium channels (left).

