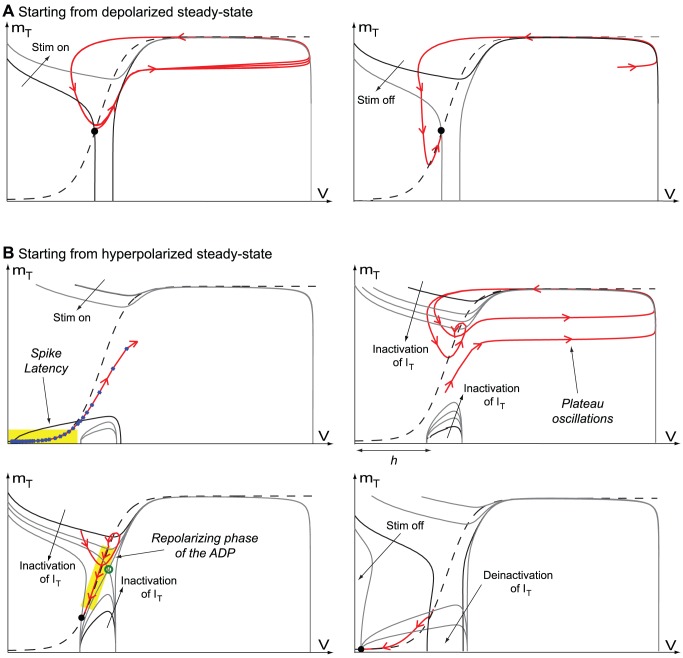
Figure 8. Phase-portraits of the reduced conductance based TC model in low (A) and high calcium conductance modes (B).
The  - and
- and  -nullclines are drawn as full and dashed lines, respectively, and the hyperpolarized state as a filled circle
  . The trajectories are drawn as red oriented lines. In high calcium conductance mode, the phase portrait shows two
  -nullclines branches which derives from a transcritical singularity.

