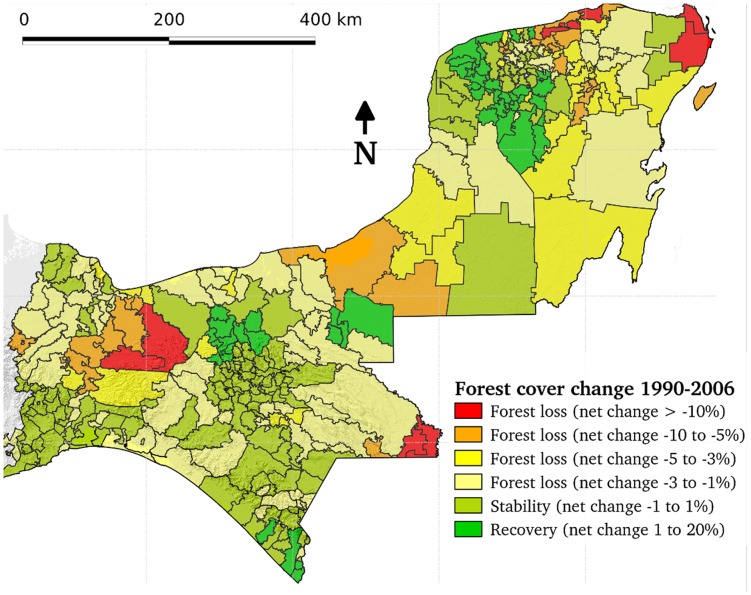
Figure 3. Net cover change between 1990 and 2006 calculated as a percentage of total land area in each municipality.
Deforestation hotspots (depicted in red) were identified based on municipalities with more than 10% of the total land area that had changed from forest to non forest during this period.

