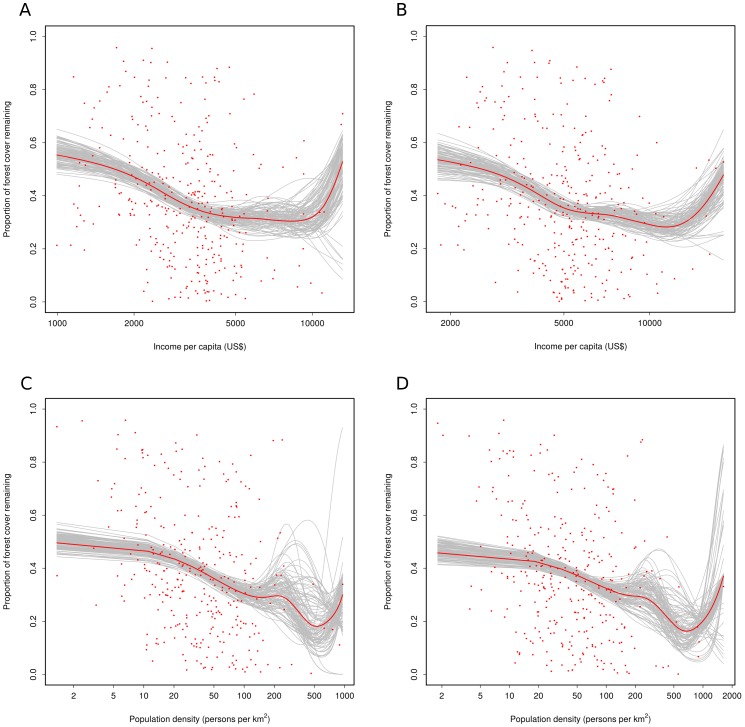
Figure 4. Beta GAM modelling on the relationship between the proportion of remaining forest cover at the municipality level and socio-economic factors.
A) Relationship between the proportion of forest cover remaining in 2000 and income per capita in 2000 (Deviance explained = 14.5%); B) Relationship between the proportion of forest cover remaining in 2006 and income per capita in 2005 (Deviance explained = 11.9%); C) Relationship between the proportion of forest cover remaining in 1990 and population density in 1990 (Deviance explained = 22.0%); and D) Relationship between the proportion of forest cover remaining in 2006 and population density in 2005 (Deviance explained = 12.8%). The bootstrapped cases and the fitted models with all the data are shown in grey and red lines, respectively. Figure 4a and 4b provide support for Kuznets’ hypothesis. Although the scatter around the trend is substantial leading to a small amount of explained deviance (<15%) the underlying relationships are a close match to that followed by an EKC. Economic development has been comparatively rapid in the region between 2000 and 2005 with approximately 5% growth in per capita income annually, leading to a change in spread along the abscissa. The figures show the highly skewed nature of income distribution, with a few municipalities that rely largely on tourism for income having per capita incomes over US$ 10,000 while most rural communities lie below US$ 5000 in both time periods. Figures 4c and 4d also display the same intrinsic variability. The model of the underlying trend shows a decline in forest cover in rural areas as population density increases up to a threshold of 100 people per km2. The trend is approximately linear on a log scale, so the gradient decreases along this part of the trajectory when the curve is plotted on a linear scale. The loss in cover slows and is ultimately reversed, even on a log scale, at a population density of around 100 persons per km2. Forest cover may decrease once again at levels of population density that are typical of densely urbanised areas, followed by an increase in the largest, long established cities (perhaps as parks and gardens are established). There are very few data points available to provide support for this part of the curve, so the bootstrapped curves take varying forms beyond the 100 person per km2 cutoff level. The shape of the right hand side of the curve is thus not established through these data.

