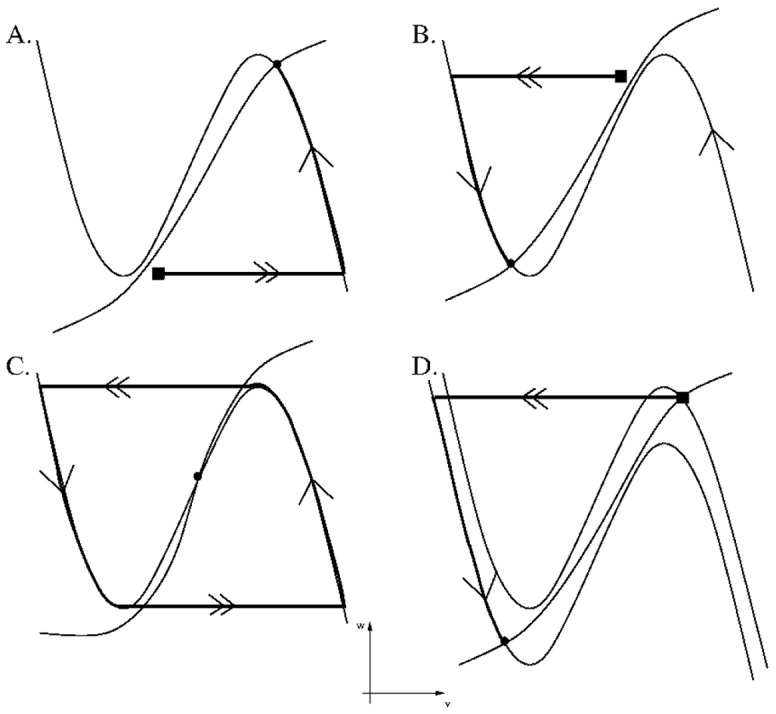
Figure 2. Nullclines and trajectories showing different intrinsic and synaptic behaviors.

In panels A, B and D, filled squares denote position of initial conditions that evolve toward particular fixed points (solid circles). Single arrows denote slow flows; double arrows denote fast transitions. A. Nullclines for an intrinsically active cell group intersect on the right branch of the v-nullcline. B. Nullclines for an intrinsically silent cell group intersect on the left branch of the v-nullcline. C. Nullclines for an intrinsically oscillatory cell group intersect on the middle branch of the v-nullcline (open circle). D. Inhibition to an intrinsically active group lowers its nullcline causing the trajectory to move from the solid square location, to the solid circle location.
