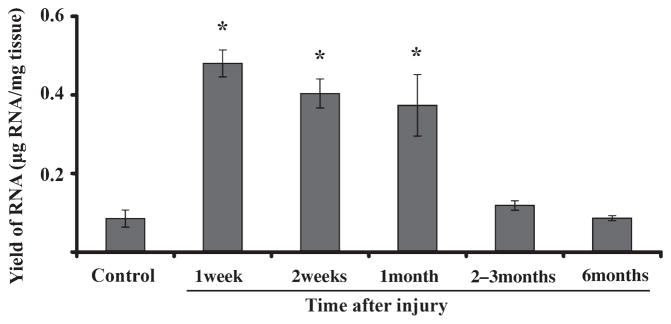
Fig. 2.
Increased RNA in distal nerve stumps of operated groups at 1 and 2 weeks and 1 month compared with controls (*p < 0.001). Control represents mean of all intact tibial nerves from all time points. Each time point represents the mean of all operated groups from that time. Error bars represent SEM.

