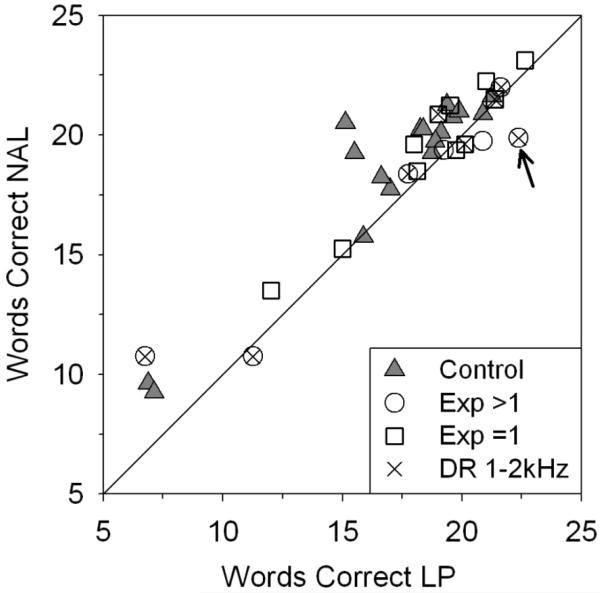
Figure 5.
BKB-SIN scores (untransformed) for the NAL and LP programs for each subject. Subjects in the control group are depicted with filled triangles. Experimental group subjects are shown with open squares (subjects with DR at one test frequency) or open circles (subjects with DRs at two or more test frequencies). The subgroup of individuals in the experimental group whose lowest DR was measured at or below 2.0 kHz are identified with an ‘X’ inside the open symbol. The arrow points to the data of subject E04.

