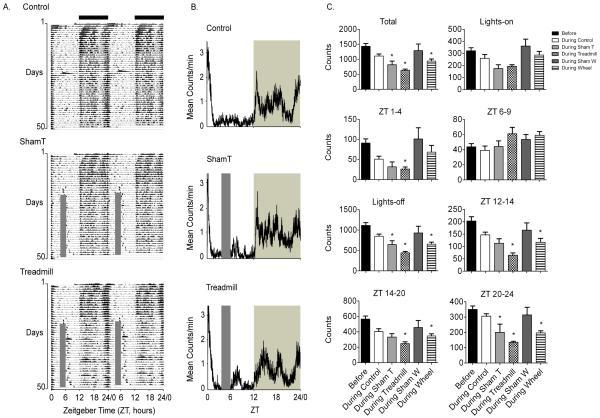
Figure 3. Alterations in locomotor cage activity following exercise in mice.
(A) Double-plotted actograms of locomotor behavior throughout the experiment and (B) averaged activity profiles (calculated from the last two weeks) from control (n=3), sham treadmill (n=4) and treadmill (n=5) mice. (C) Mean activity counts throughout the day in control, sham treadmill (ShamT), treadmill, sham wheel (ShamW) and wheel groups. Before (black bars) is the locomotor cage activity in the two weeks prior to exercise averaged from all groups during time points indicated on each graph. During control, during ShamT, during treadmill, during ShamW, and during wheel were calculated from the final two weeks of exercise, * indicates significant from before (*p<0.05, mean ± SEM, ANOVA, post hoc Dunnett’s). Dark bars (A) and shaded area (B) represent time of lights-off, gray bars (A and B) indicate when animals were exposed to exercise.

