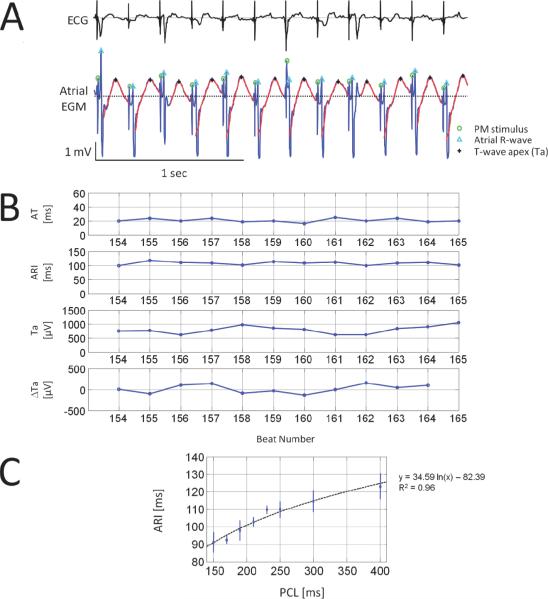
Figure 1. Ovine atrial unipolar EGM and time series.
A representative example of subcutaneous bipolar ECG (top) and corresponding unipolar electrograms (EGM, bottom) at a pacing cycle length (PCL) of 210ms is shown in panel A. Green circles denote pacemaker (PM) stimuli, cyan triangles the first atrial depolarization wave (R-wave) and black stars atrial T-wave apexes (Ta). Repolarization waves are highlighted by red bold curves. Panel B shows from top to bottom time series of AT, activation recovery interval (ARI), Ta and beat-to-beat difference in Ta (ΔTa) from the EGM shown above. Panel C illustrates the non linear (i.e. logarithmic fit) relationship between ARI (mean±SD) and PCL determined in a subset of 8 sheep.

