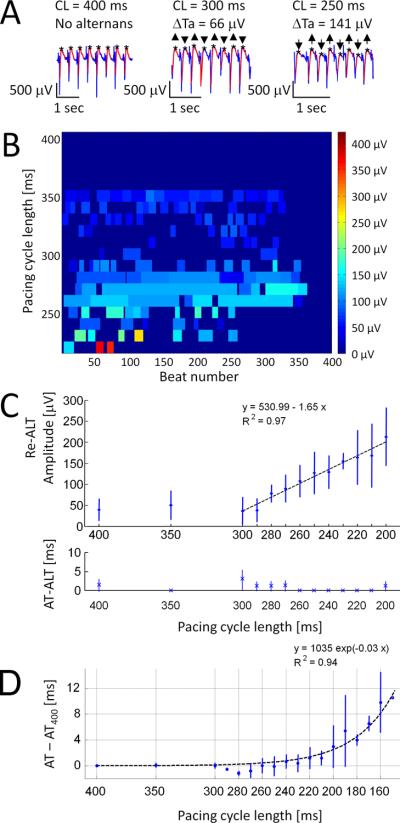
Figure 2. Rate dependence of Re-ALT.
Panel A shows examples of atrial EGM at decreasing PCLs. Panel B displays Re-ALT magnitude over a 400-beat pacing protocol. Significant Re-ALT sequences are displayed as rectangles of variable duration (number of beats, x-axis) and amplitude (0 to 400μV, colorscale) at decreasing PCLs (400 to 220ms, y-axis). Panel C reports (n=4 sheep with AV block) mean±SD of Re-ALT amplitude (top) and activation time alternans (AT-ALT, bottom), and panel D mean±SD of AT prolongation (defined as the difference from baseline value (AT-AT400ms)) as a function of PCL.

