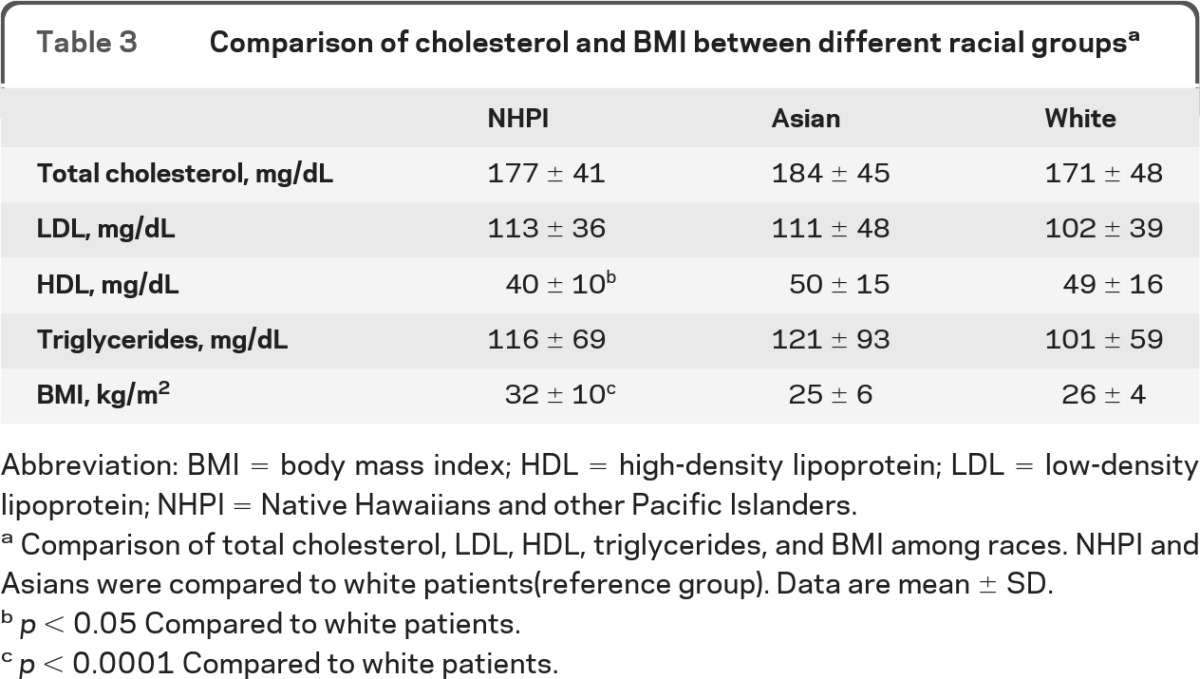
Table 3.
Comparison of cholesterol and BMI between different racial groupsa

Abbreviation: BMI = body mass index; HDL = high-density lipoprotein; LDL = low-density lipoprotein; NHPI = Native Hawaiians and other Pacific Islanders.
Comparison of total cholesterol, LDL, HDL, triglycerides, and BMI among races. NHPI and Asians were compared to white patients(reference group). Data are mean ± SD.
p < 0.05 Compared to white patients.
p < 0.0001 Compared to white patients.
