
Table 1.
Demographic information of gene-nonexpanded, gene-expanded, healthy control, and combined control group
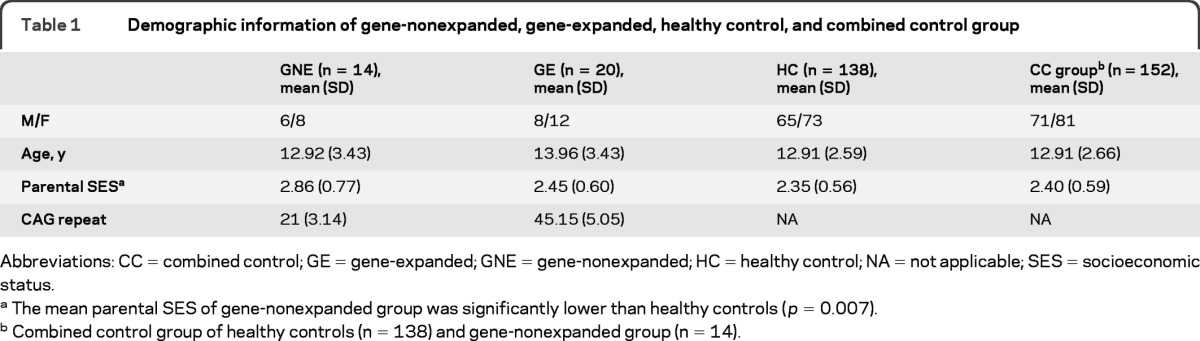
Abbreviations: CC = combined control; GE = gene-expanded; GNE = gene-nonexpanded; HC = healthy control; NA = not applicable; SES = socioeconomic status.
a
The mean parental SES of gene-nonexpanded group was significantly lower than healthy controls (p = 0.007).
b
Combined control group of healthy controls (n = 138) and gene-nonexpanded group (n = 14).