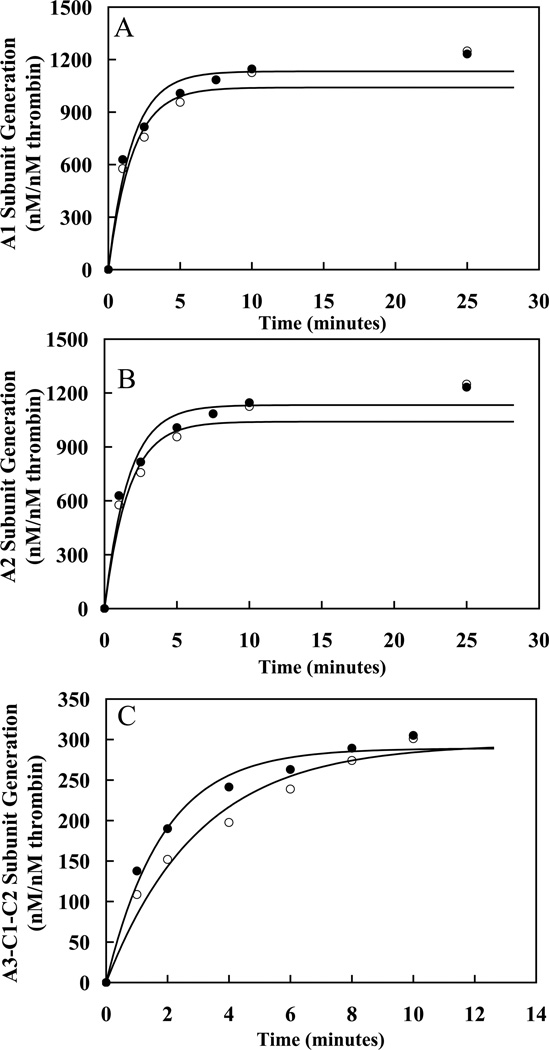
Figure 5. Analysis of the Western Blots of the Combination P3-P3′ FVIII mutants.
Panels A–C plot rates derived from densitometry scans of the blots in Figure 4 for rates of generation of A1 (A), A2 (B) and A3-C1-C2 (C) subunits for 372(P3-P3′)740/R740Q (●) and 372(P3-P3′)740/740(P3-P3′)372 (○) FVIII. Lines are drawn representing the initial time points of the data fit to a single exponential equation using non-linear least squares regression as described in “Experimental Procedures.” Experiments were performed at least three separate times and average values are shown.

