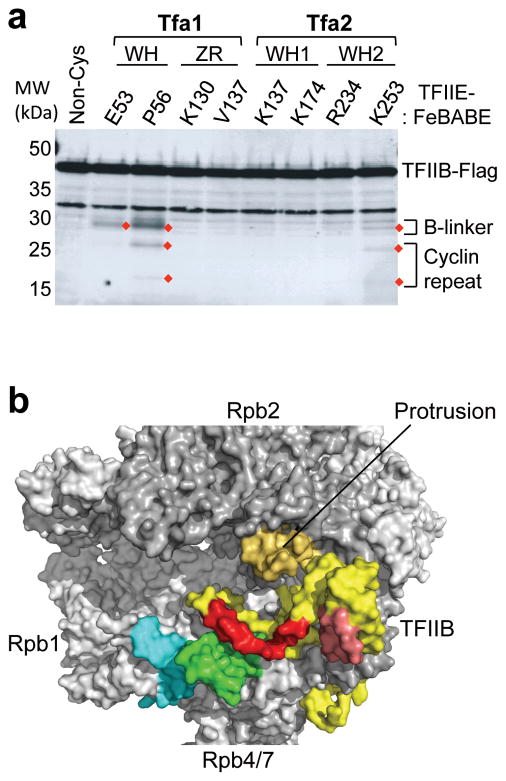
Figure 3.
Cleavage of TFIIB by TFIIE-FeBABE in the PIC. (a) TFIIB cleavage products generated by TFIIE-FeBABE. PICs containing the indicated TFIIE-FeBABE derivatives and TFIIB-Flag were treated with H2O2 and analyzed by Western blot. Cleavage products are highlighted with red diamonds, and the brackets on the right indicate cleavage in either the B-linker or the first TFIIB cyclin repeat domain. (b) Cleavage results from a were mapped to TFIIB (yellow) where 10 residues on either side of the calculated cleavage site are highlighted (red = cleavage in the TFIIB linker region; salmon = cleavage in the first TFIIB cyclin repeat). Cleavages in Pol II are colored as described in Figure 2c.

