
Fig. 1.
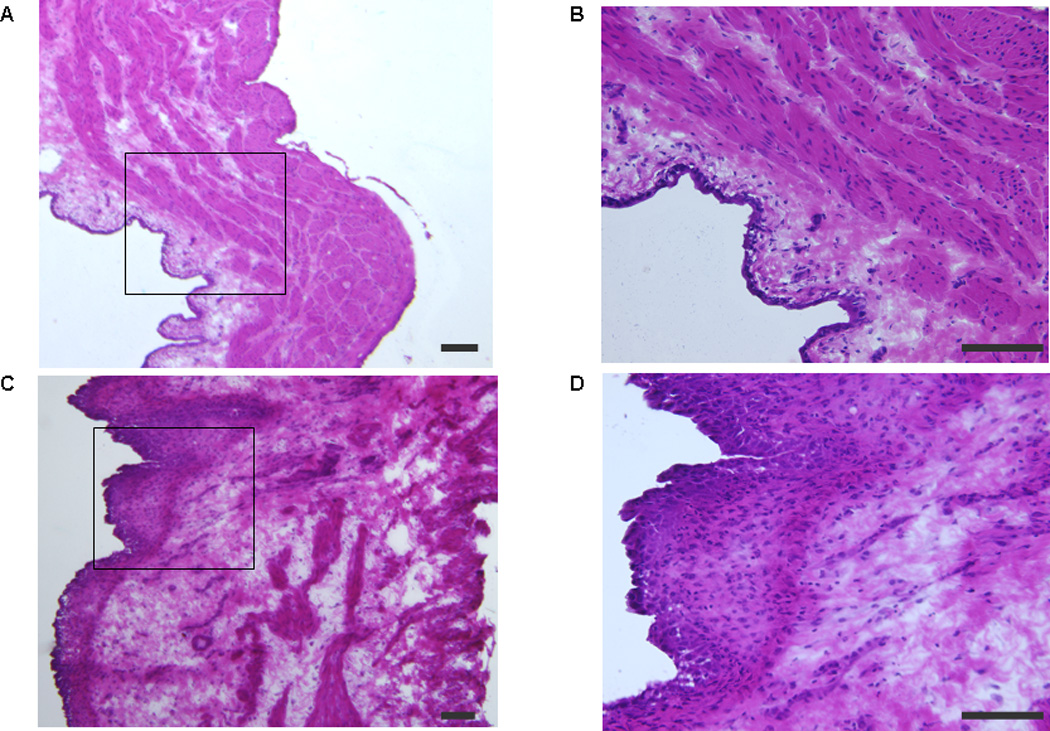
Photomicrographs of hematoxylin and eosin staining of the bladder wall in sham (saline) and cyclophosphamide (CYP)–treated rats: (a) sham rat bladder (×40); (b) sham rat bladder (×200); (c) CYP-treated rat bladder (×40); (d) CYP-treated rat bladder (×200). Figure 1b and 1d show the areas indicated by rectangles in Figure 1a and 1c, respectively, with higher magnification. Inflammatory cell infiltration in the suburothelial layer and tissue edema shown by an increase in the mucosal layer width are observed in the CYP-treated group (c and d). Scale bars: 100 µm.