
Fig. 6.
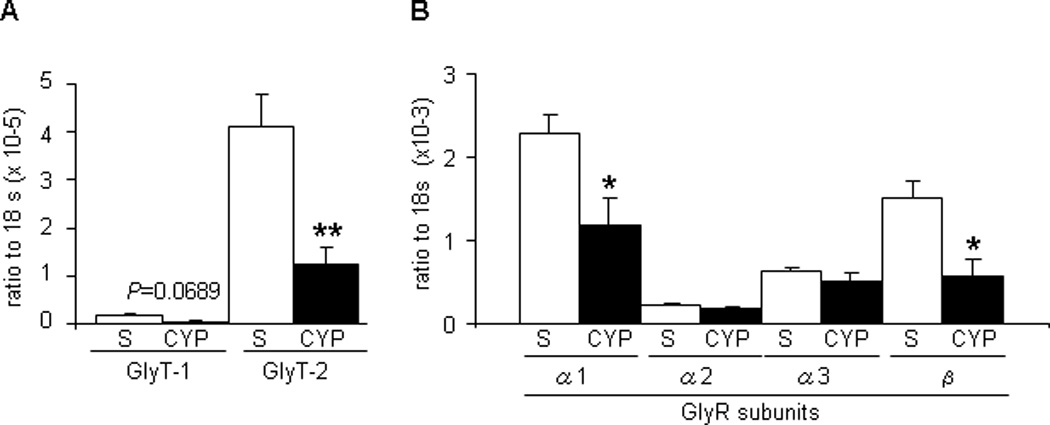
Changes in messenger RNA levels of (a) glycine transporters and (b) glycine receptor subunits in the dorsal L6–S1 spinal cord at the after cyclophosphamide treatment. Each bar represents the mean plus or minus the standard error of the mean from five different rats.
S = sarcosine; CYP = cyclophosphamide; GlyT = glycine transporter; GlyR = glycine receptor; PCR = polymerase chain reaction; NCBI = National Center for Biotechnology Information.
* p < 0.05.
** p < 0.01 (unpaired student t test); the real-time PCR was run by 40 cycles (denaturation at 95°C for 15 s; primer annealing at 55°C for 60 s; elongation at 72°C for 30 s); relative expression data were quantified using the 2-ΔΔCT method, where CT is the cycle threshold. All target messenger RNA (mRNA) expression levels were normalized to that of the constitutive 18S ribosomal RNA. Primer sequences used for real-time PCR were as described in Table 2. All primers for PCR reaction were designed based on the NCBI database sequence of rat reference mRNA and checked for specificity with BLAST software from the NCBI Web site. PCR products were also validated by size determination after separation on 2% agarose gel.