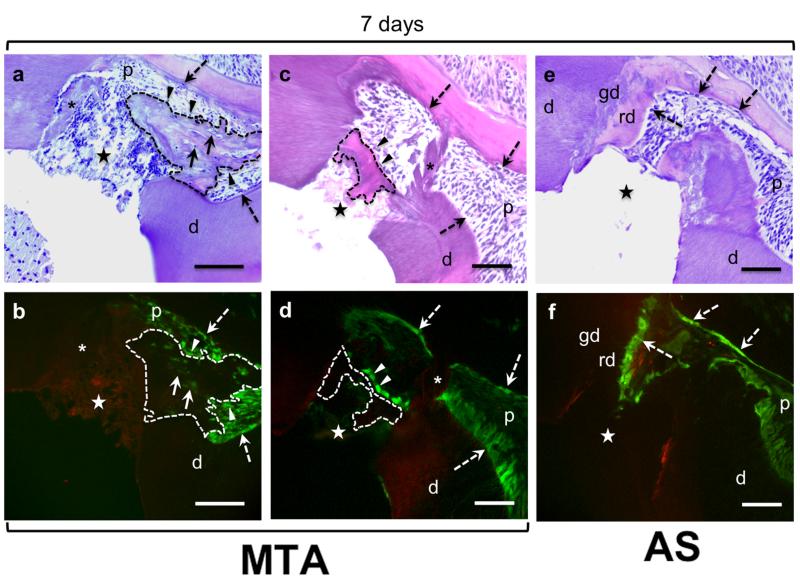
Figure 3.
Histological sections stained with H & E (a, c, e) and epifluorescence analyses of adjacent sections (b, d, f) of teeth from 3.6-GFP transgenic mice with CD1 background 4 weeks after pulp exposure. (a - d) are representative images of sections from teeth capped with MTA. (e and f) are representative images of adjacent section from a tooth capped with AS. (a and b) show the formation of newly synthesized matrix (outlined with dashed lines) that extends into the pulp from exposure site. This matrix is atubular and contains 3.6-GFP expressing cells (indicated by arrowheads) and 3.6-GFP expressing cells embedded in the matrix (indicated by full arrows) resembling osteodentine. (c and d) show the formation of a well-defined dentine bridge (outlined with dashed lines). Note the 3.6-GFP expressing cells (indicated by arrowheads) lining this bridge. Note the presence of dentine chips (indicated by asterix) in images (a-d), dentine chips at this time point are devoid of 3.6-GFP expressing odontoblast. (e and f) show the thickened layer of reactionary dentine (rd) over a globular calcified dentine (gd) at the borders of the pulp close to the exposure site. Note the high expression of 3.6-GFP in original odontoblasts underneath the reactionary dentine around the pulp (indicated by dashed arrows). Abbreviations: d=dentine; gd=globular calcified dentine, p=pulp; rd=reactionay dentine; (*)= dentine chips; (dashed arrow)= original odontoblasts; star= exposure site. Scale bar= 100μm.

