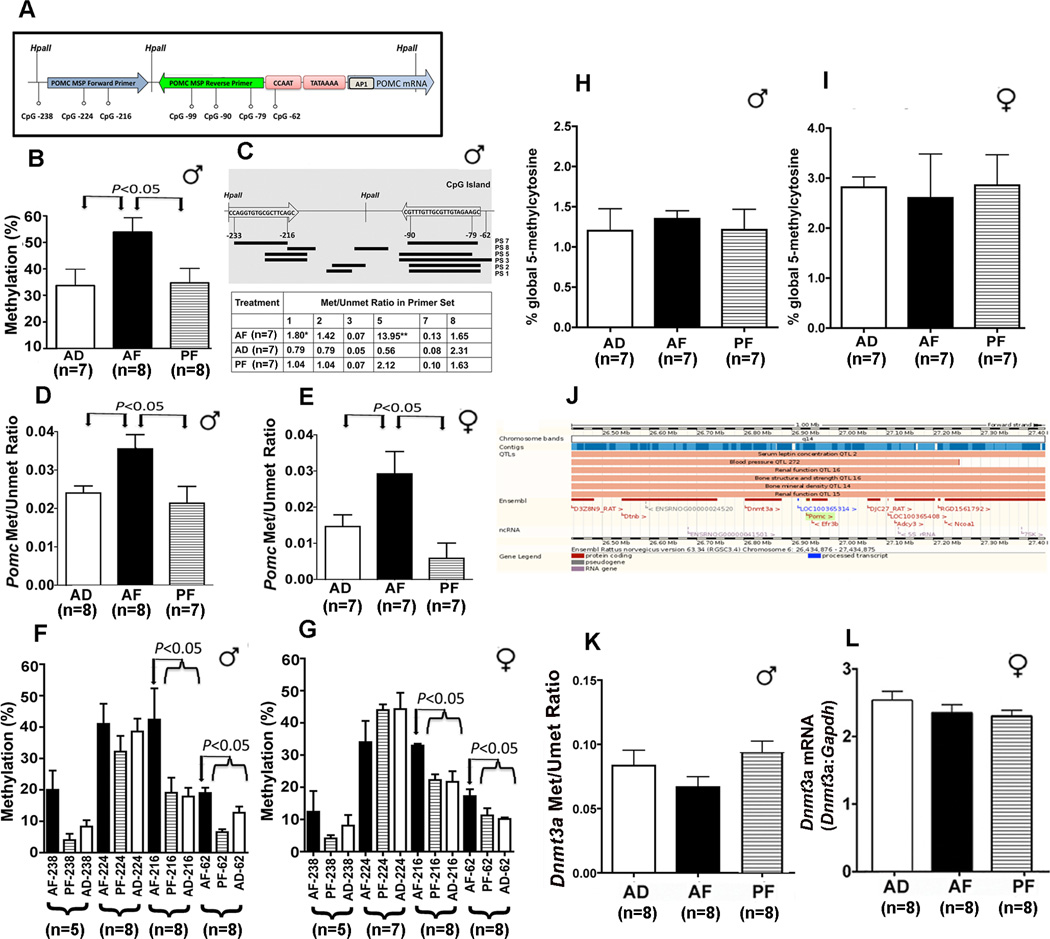
Figure 2. Fetal alcohol- Pomc gene methylation in the arcuate of the hypothalamus of F1 adult rat offspring.
Showing the different CpG sites and HpaII sites on the rat Pomc proximal promoter and the area covered by the primers used in the MSP assay used in this study (A). The percentage of methylation as assessed by HpaII digestion followed by real-time PCR with the primers chosen from the regions flanking the restriction sites of the Pomc gene in DNA prepared from the ARC of alcohol-fed (AF), pair-fed (PF) and ad lib-fed (AD) male rats (B). Changes in methylation state of different CpG sites in the Pomc promoter as assessed by bisulfite conversion followed by real-time PCR using primer sets spanning different CpG sites of the Pomc promoter (top; C) and determining the methylation-to-unmethylation ratio presented in the table (bottom; C). Methylation-to-unmethylation ratio of the CpG pairs in the −81 to −154 region of the Pomc promoter as measured using TaqMan methylation-specific real-time PCR in the ARC of males (♂) and female (♀) AF, PF and AD rats (D, E). DNA methylation status of four CpG dinucleotides from proximal POMC promoter determined by pyrosequencing analysis of the ARC of AF, PF and AD male (F) and female (G) rats. After bisulfite conversion, the DNA was subjected to pyrosequencing in regions encompassing four CpG dinucleotides. The numeration starts from the POMC gene transcription start site. 5-methylcytosine levels in the DNA of ARC of AD, AF and PF male and female rats were measured using MethylFlash Methylated Quantification kit (Epigentek, NY) and shown in panels (H and I). Showing the location of the Rattus norvegicus Dnmt3a gene relative to Pomc gene as illustrated in Ensembl Genome Browser (J). Showing the effects of fetal alcohol exposure on Dnmt3a gene methylation (K) and Dnmt3a mRNA (L) in the ARC of the hypothalamus in rats prenatally exposed to alcohol (AF) or control diets (PF and AD). Data presented are mean ± s.e.m. The number of animals was indicated within brackets under each histogram. Data shown in panels were analyzed using one-way ANOVA followed by Student-Newman-Keuls posthoc test, except those of Pomc methylation and unmethylated ratio, which was analyzed using Kruskal-Wallis ANOVA followed by Dunn's posttest (see Table S3 in the Supplement). The significance of difference between groups was identified by a bar above the histograms.

