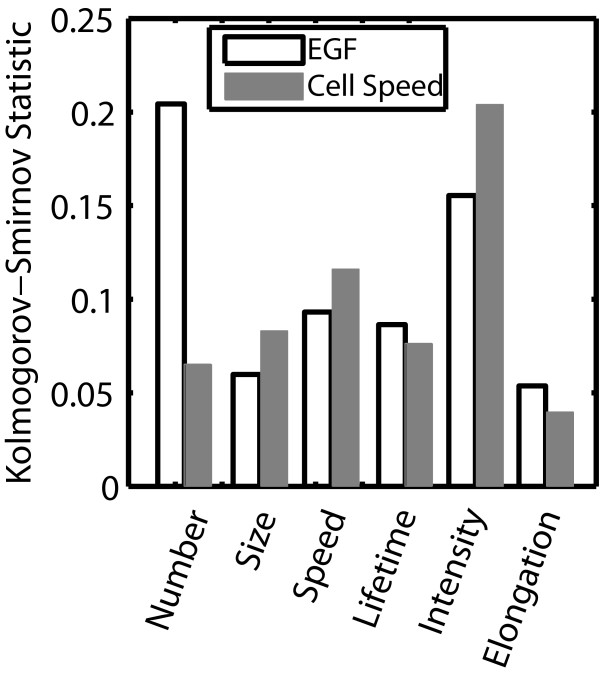
Figure 3.
Quantification of the difference between experimental distributions of FA properties. Cells were binned based on EGF concentration (no (0 nM), low (0.1 and 0.01 nM) and high (100, 10 and 1 nM)) or cell speed (low (<42 μm/hr) or high (>42 μm/hr)). The Kolmogorov-Smirnov statistic was the average of three pair-wise comparisons (EGF) or simply the pair-wise comparison (cell speed). A larger value for the Kolmogorov-Smirnov statistic signifies a higher probability that there are differences between groups.

