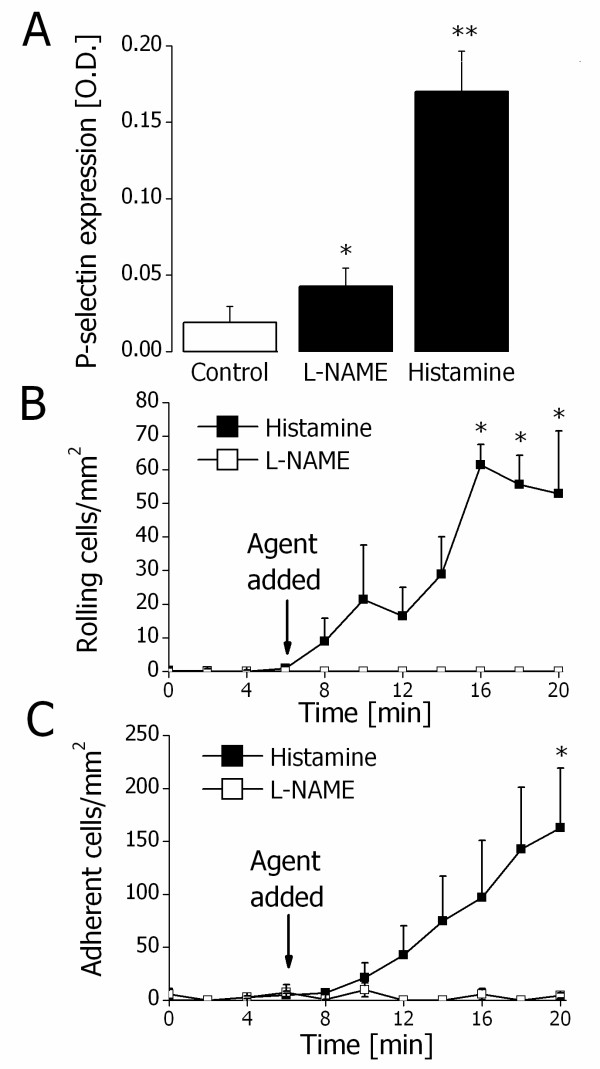
Figure 4.
L-NAME-sensitive P-selectin expression and function in vitro. A. Endothelial P-selectin expression in controls (white bar) and after treatment with L-NAME (100 μM) or histamine (25 μM) for 10 min (black bars). * and ** indicate P < 0.05 and P < 0.01, respectively, difference from the control (t test). Data are means ± SEM (n = 4). B. Rolling neutrophils before and after treatment of HUVECs with 100 μM L-NAME (white squares) or 25 μM histamine (black squares). * indicates P < 0.05 difference from the value prior to treatment (ANOVA). Data are means ± SEM (n = 4). C. Adherent neutrophils before and after treatment of HUVECs with 100 μM L-NAME (white squares) or 25 μM histamine (black squares). * indicates P < 0.05 difference from the value prior to treatment (ANOVA). Data are means ± SEM (n = 4).

